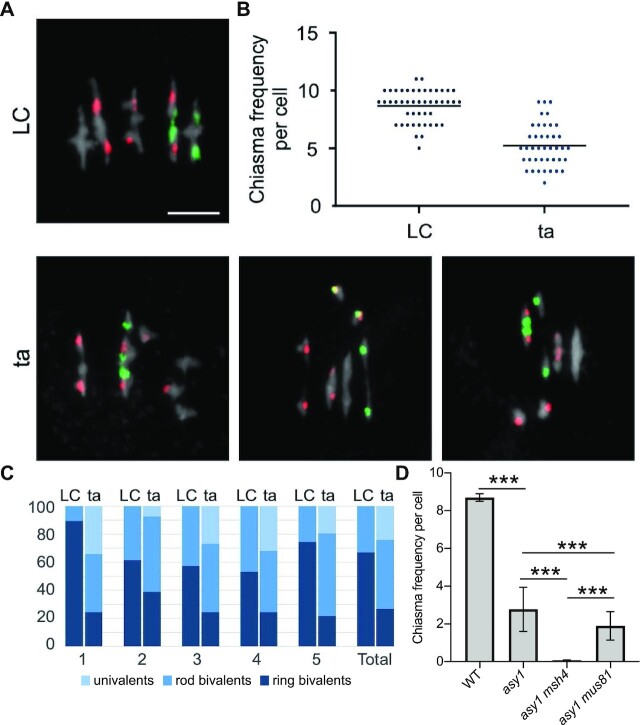
Fig. 5.
Determination of the chiasmata number in asy1 mutants using FISH. (A) Representative metaphase I nuclei of LC (up) and ta (down) meiocytes using FISH to identify the different chromosome types. Red signals (5S rDNA loci) are present in chromosomes 3, 4, and 5, whereas green signals (45S rDNA loci, NORs) appear in the acrocentric chromosomes 2 and 4. DAPI staining appears in gray. Examples of ta cells include univalents in different chromosomes: 1 and 3 (left); 4 (middle); 5 (right). Bars represent 5 µm. (B) Quantification of chiasmata in metaphase I cells. Each dot represents an individual cell and bars indicate the mean. (C) Percentage of pairs of univalents, rod bivalents (with chiasmata only in one chromosome arm), and ring bivalents (with at least one chiasma on both chromosome arms) in the WT LC hybrids (left) and the ta hybrids (right). (D) Quantification of chiasmata in metaphase I cells in WT, asy1, asy1 msh4, and asy1 mus81 mutant plants. *** P < 0.0001.

