Fig. 7.
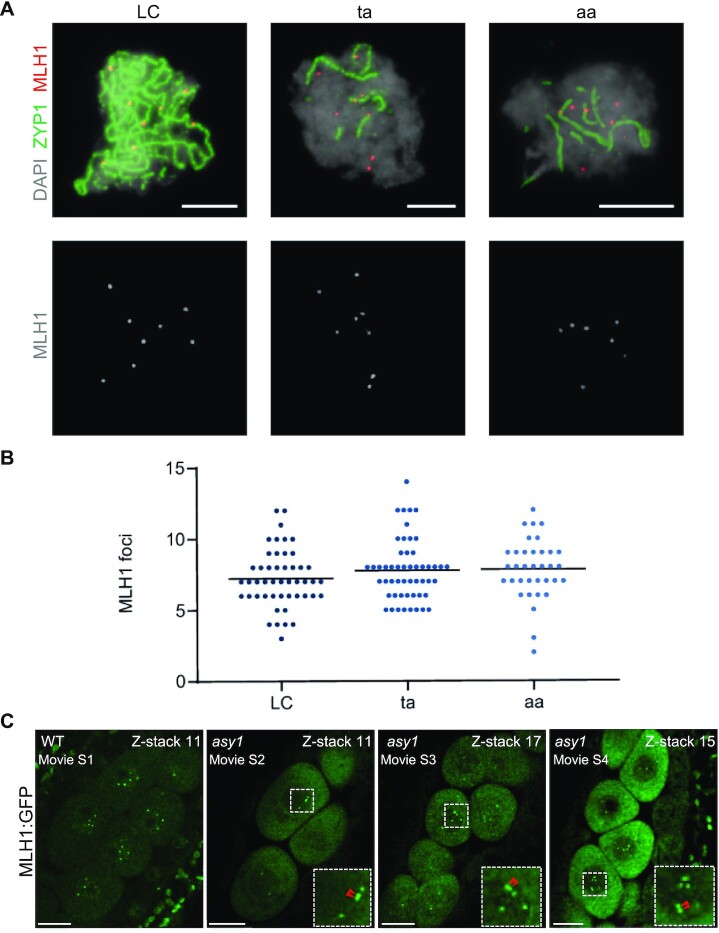
Analysis of MLH1 foci. (A) Representative images showing pachytene (LC) and pachytene-like (ta, aa) meiocytes after immunolabeling for detecting the class I CO marker MLH1 (red). The central element protein of the SC ZYP1 is detected in green and DAPI staining appears in gray. Bars represent 5 µm. (B) Comparison of the number of MLH1 foci. Each dot represents an individual cell and bars indicate the mean. (C) Presence of MLH1 foci in WT and asy1 mutant plants. One of the z-stacks was shown from Supplementary Movies 1 to 4. Red arrows indicate the closely located MLH1 foci. Bars represent 10 µm.

