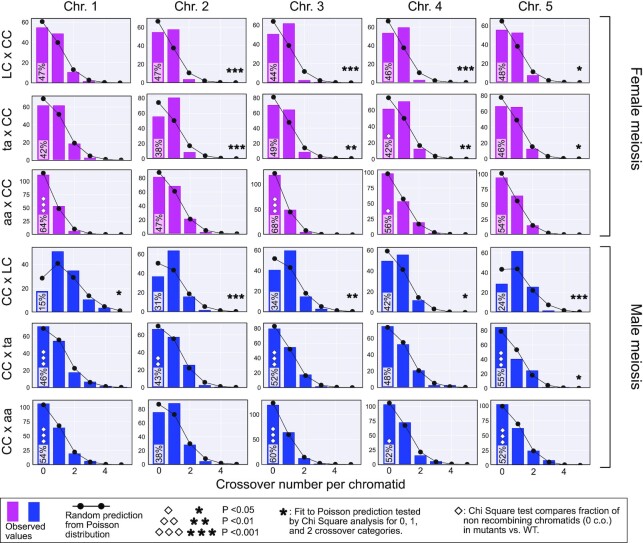
Fig. 9.
Comparison of CO numbers per chromatid in WT and asy1 mutants. The bar plots illustrate the count of chromatid classes for given genotypes and chromosomes. Pink and blue bars are for female and male meiosis, respectively. The random expectation according to the Poisson distribution is displayed by the black line with round black circles. The star markers display significance of the random fit (low P corresponds to significant deviation). Note that almost all chromosomes for both test crosses significantly deviate from a random distribution while all asy1 null mutants and most of the asy1 hypomorphic mutant show a pattern that matches a poisson distribution. The % of the 0 CO chromatid class is displayed inside the 0 CO bar. For this fraction of 0 CO chromatids, the P of the Chi Square comparison with WT values is marked with diamonds (low P corresponds to significant deviation). The exact number of instances in each category can be found in Table S6.

