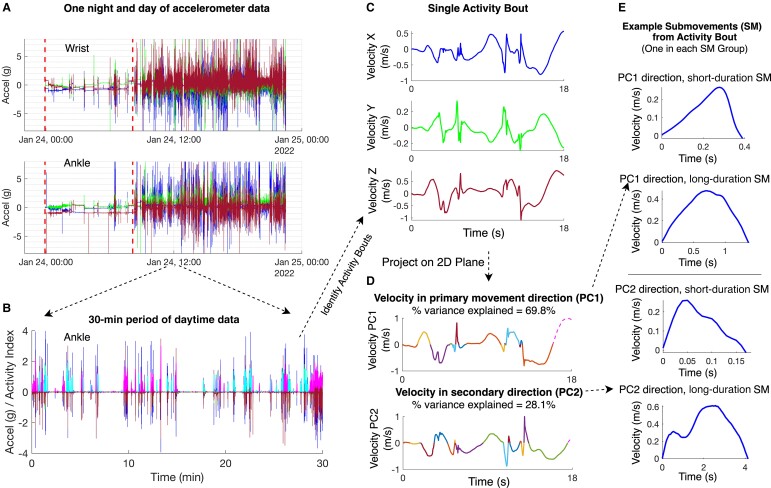
Figure 1.
Overview of wearable sensor data processing steps. (A) One night and day of triaxial accelerometer data shown from a single individual (wrist sensor on top and ankle sensor below). The three lines (blue, green, and red) represent acceleration in the x, y and z directions, respectively. Vertical dotted lines mark the nighttime period. (B) A 30‐min segment of triaxial accelerometer data from the ankle sensor. Activity index (normalized to 0–2 range) is plotted for each identified activity bout, alternating between colours (magenta and cyan) to identify each discrete bout. (C) A single activity bout in velocity–time space. (D) The activity bout projected onto a 2D plane using principal component analysis (PCA), with the primary (PC1) and secondary (PC2) directions of movement plotted. Submovements identified from the activity bout are plotted in different colours[AQ12]. (E) Four submovements from the activity bout are shown, one in each of the four submovement groups based on duration (short or long) and direction of movement (PC1 or PC2).

