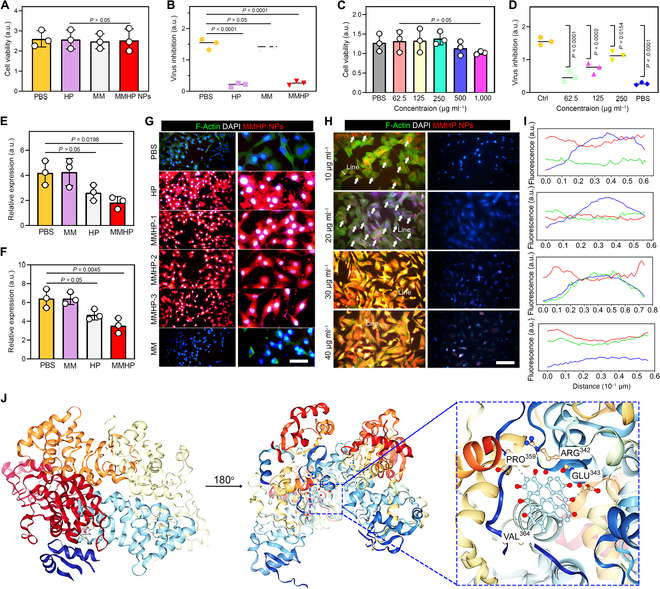
Fig. 4.

The cell nuclei-targeted capability of MMHP NPs and corresponding antivirus mechanism. (A) The MTT assay of PBS, HP, MM, and MMHP NPs toward A549 cells after 1 d of incubation. (B) The antivirus assay of PBS, HP, MM, and MMHP NPs toward A549 cells with H1N1 virus after 1 d of incubation. (C) The MTT assay of MMHP NPs with different concentrations toward A549 cells after 1 d of incubation. (D) The antivirus assay of MMHP NPs with different concentrations toward A549 cells with H1N1 virus after 1 d of incubation. The Ctrl group means that the cells were incubated without H1N1 virus. (E) The ELISA of NP protein expressions of PBS, HP, MM, and MMHP NPs. (F) The NP gene expressions of PBS, HP, MM, and MMHP NPs. (G) The fluorescence staining images of A549 cells (the concentrations of HP, MMHP-1, MMHP-2, MMHP-3, and MM were 250, 125, 250, 500, and 250 μg ml−1, respectively). Scale bar, 25 μm. (H) The fluorescence staining images of A549 cells with lower MMHP NP concentration. Scale bar, 20 μm. (I) The fluorescence intensity of green, blue, and red fluorescence along with the lines. (J) The molecular docking between NP and HP. (A) to (F) were analyzed with one-way ANOVA.
