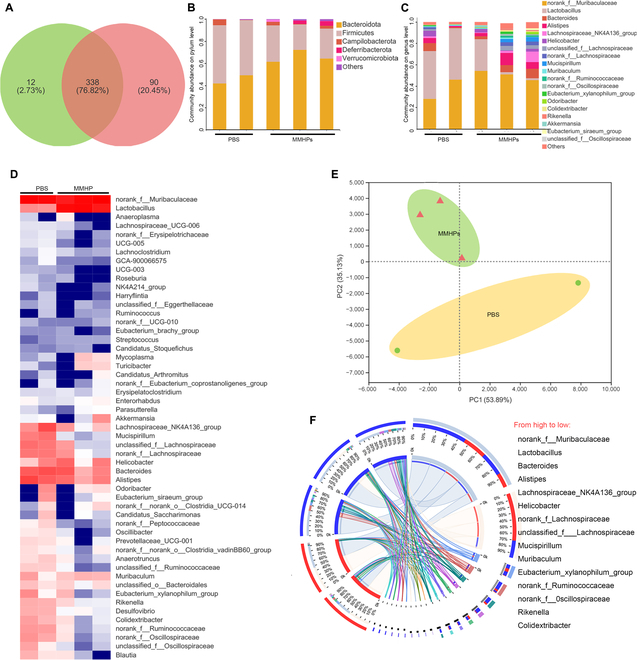
Fig. 7.

MMHP NPs mediated gut microbiota. (A) The Venn diagram shows the number of bacterial strains in infected mice’ intestinal tract. (B) The principal components analysis plot showing the distinct separation based on the bacterial strains’ profiles of PBS and MMHP NPs. (C) Differential bacterial strain heat maps of PBS- and MMHP NP-treated mice. (D) The differential bacterial strains of PBS- and MMHP NP-treated mice. (E) The composition of differential bacterial strains of PBS- and MMHP NP-treated mice. (F) The cladogram of gut microbiota treated by PBS and MMHP NPs.
