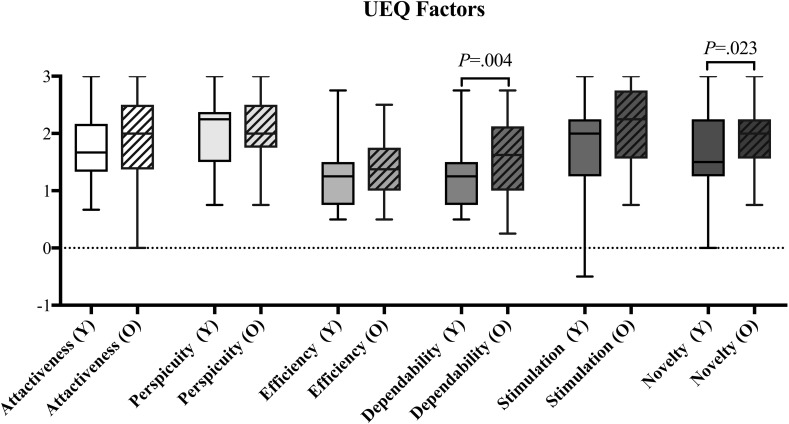
Fig 3. Boxplot of User Experience factors for the Younger group (Y), and for the Older group (O), showing large variability for most factors in both groups.
All factors showed differences in the median, but only Dependability and Novelty showed differences on a significant level. Whiskers indicate the 25th and 75th percentiles.

