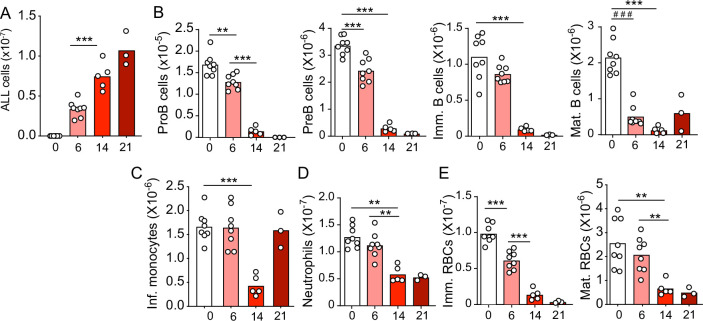
Figure 1. Kinetics of B-ALL growth and impact on hematopoiesis.
(A) B-ALL number. (B) Number of non-malignant developing B cell subsets. (C) Inflammatory monocytes. (D) Neutrophils. (E) Immature (Ter119+CD71+) and mature (Ter119+CD71-) red blood cells. Data in all panels show bone marrow cell numbers obtained from wild-type (WT) mice transplanted with 3×10⁶ BCR-ABL-expressing B-ALL cells. In all panels, X-axis indicates time (days) after B-ALL transplantation. Bars indicate mean, circles depict individual mice. Data are representative of two independent experiments. **p<0.005; ***p<0.0005 unpaired, two-sided, Student’s t test. ###p<0.0005 Mann–Whitney test. ALL, acute lymphoblastic leukemia.

