. 2023 Mar 6;12:e85494. doi: 10.7554/eLife.85494

Figure 2. Transferred macrophage mitochondria are long-lived, depolarized, and accumulate reactive oxygen species, promoting cancer cell proliferation.

(a) Stills from time-lapse imaging depicting the longevity of the transferred mitochondria (green, arrowhead) within a 231 cell (magenta, cell outline in white). Time elapsed listed in left corner. (b) Confocal image of a mito-RFP+ 231 cell (magenta) containing macrophage mitochondria (green, arrowhead) stained with MTDR (yellow) and LysoTracker (teal). MTDR does not accumulate in 100% of donated mitochondria (N=25 cells, 5 donors). Majority (57%) of donated mitochondria do not colocalize with LysoTracker signal (N=24 cells, 4 donors). (c) Ratiometric quantification of mito-Grx1-roGFP2 biosensor mapped onto the recipient 231 cell with fire LUT (top panel). Confocal image of mito-Grx1-roGFP2-expressing 231 cell (bottom right, green and yellow) containing a macrophage mitochondria (bottom left, red, arrowhead). (d) Ratiometric measurements of the mito-Grx1-roGFP2 sensor per 231 cell (paired dots) at a region of interest containing the host mitochondrial network (host) or a transferred mitochondria (transfer). Cells were co-cultured for 24 hr (N=27 cells, 3 donors indicated in shades of gray). (e) Exogenous purified macrophage mitochondria (green) is void of mitochondrial membrane potential (MitoTracker Deep Red-negative, yellow, arrowhead) in cancer cells. (f) Cell cycle analysis of cancer cells with exogenous purified macrophage mitochondria versus sister cells that did not take up exogenous purified mitochondria, either treated with vehicle or 100 μM mitoTEMPO (mitochondrially-targeted superoxide scavenger. N=3 donors; statistics for G2/M only). (g) Schematic of optogenetic experiments to generate data in (h). Cells expressing mito-KillerRed are photobleached in a specific ROI containing either cytoplasm only (left) or mito-KillerRed+ mitochondria (right). Following photobleaching, cells are imaged over time to quantify the amount of cell division. (h) Quantification of cell division after photobleaching. Each data point is the average within a field of view (N=13 experiments), with control (cyto) and experimental (mito) data shown as paired dots per experiment. Scale bars are 10 µm. Wilcoxon matched-pairs signed rank test (d, h), two-way ANOVA (f), *p<0.05; ****p<0.0001.
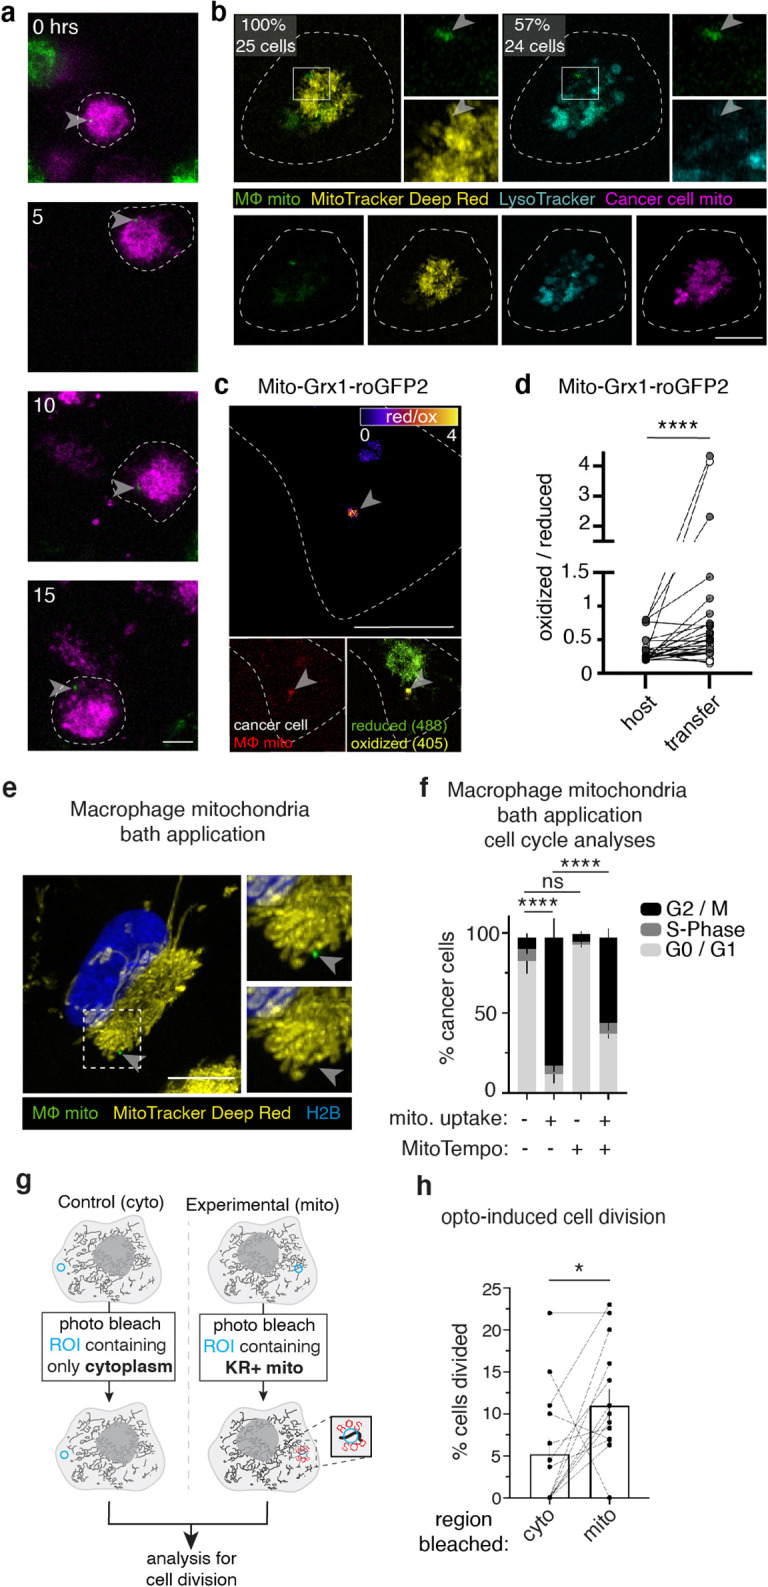
Figure 2.

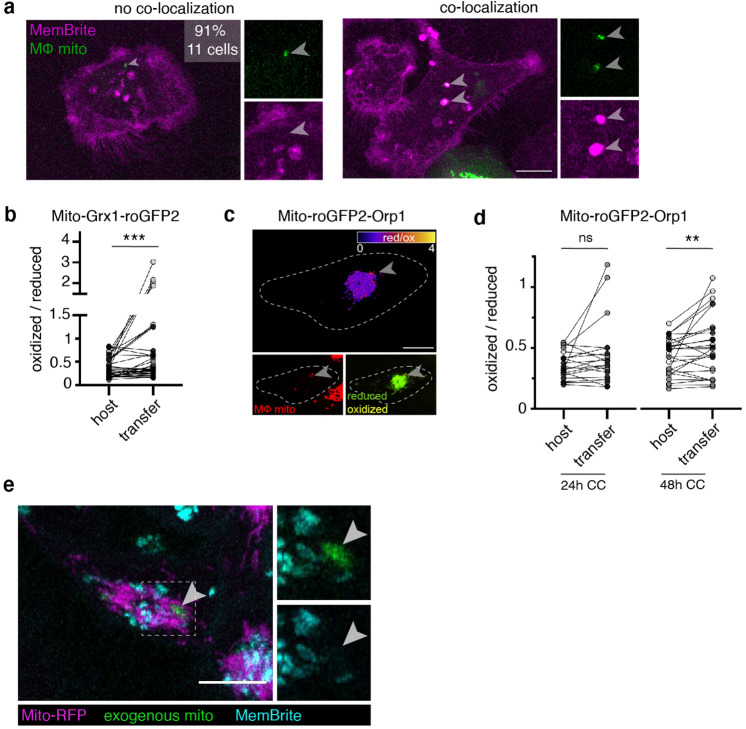
Figure 2—figure supplement 1. Transferred mitochondria accumulate reactive oxygen species, and internalized exogenous mitochondria are not encapsulated in a membrane compartment.

Figure 2—figure supplement 1.

(a) Recipient 231 cells were stained with a dye, MemBrite, that marks both the plasma and vesicular membranes. 91% of transferred mitochondria (green, arrowheads) did not co-localize with MemBrite signal (magenta, left panel) whereas 9% did (right panel) (N=11 cells, 1 donor). (b) Ratiometric measurements of the mito-Grx1-roGFP2 sensor per 231 cell (paired dots) at a region of interest (ROI) containing the recipient host mitochondrial network (host) or a transferred mitochondria (transfer). Cells were co-cultured with macrophages for 48 hr (N=37 cells, 3 donors), individual donors are indicated as shades of gray. (c) Ratiometric quantification of mito-roGFP2-Orp1 biosensor mapped onto recipient 231 cell in the fire LUT (top). Bottom left panel shows macrophage mitochondria (bottom left, red, arrowhead) and bottom right shows mito-roGFP2-Orp1 (green and yellow). (d) Ratiometric measurements of the mito-roGFP2-Orp1 sensor per 231 cell (paired dots) at a ROI containing the host mitochondrial network (host) or a transferred mitochondria (transfer). Cells were co-cultured with macrophages for 24 hours (N=21 cells, 3 donors, left) or 48 hr (N=26 cells, 3 donors, right).( e), Mitochondria were isolated from mito-mEm expressing THP-1 cells. The purified mitochondrial preparations (green) were perfused onto MDA-MB-231 cells expressing mito-RFP (magenta). 24 hr after mitochondrial uptake, MDA-MB-231 cells were stained with MemBrite (cyan) to visualize membranes. Longer incubations with MemBrite stain allow for visualization of internal membrane structures (intracellular cyan-positive structures in the image), and internalized exogenous mitochondria did not colocalize with MemBrite staining (arrowheads). Individual donors are indicated as shades of gray. All scale bars are 10 μm. Wilcoxon matched-pairs signed rank test (b, d), **p<0.01; ***p<0.0001.
Figure 2—figure supplement 2. Inducing reactive oxygen species results in cancer cell proliferation.
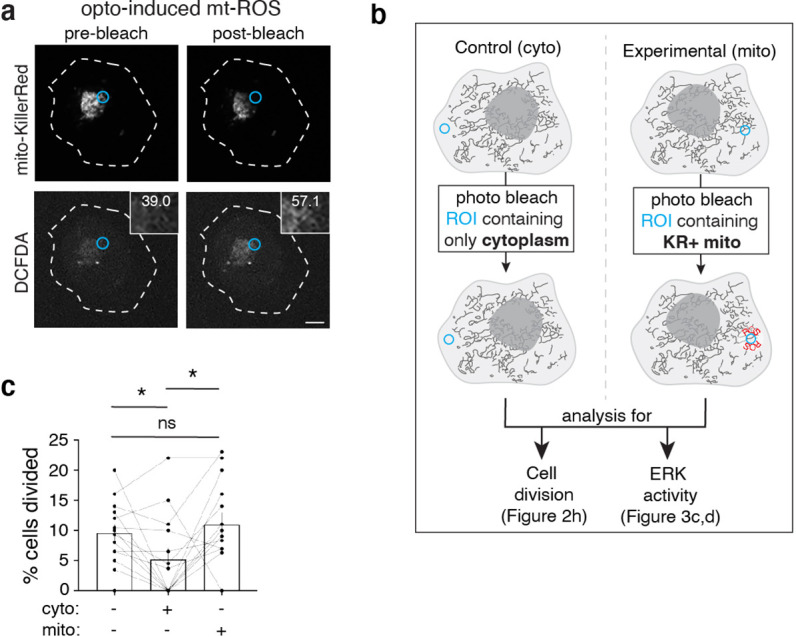
Figure 2—figure supplement 2.

(a) Photobleaching a region of interest (ROI; blue) containing KillerRed + mitochondria (top panels) generate an increase in ROS levels (DCFDA, ROS indicator, bottom panels). Mean fluorescent intensity (MFI) of DCFDA list in the inset. (b) Schematic of optogenetic experiments to generate data in Figure 2g and h and Figure 3c and d. Cells expressing mito-KillerRed are photobleached in a specific ROI containing either cytoplasm only (left) or mito-KillerRed+ mitochondria (right). Following photobleaching, cells are imaged over time to quantify the amount of cell division (Figure 2g and h) or ERK activity (Figure 3c and d). (c) Data from Figure 2h plotted next to an additional control. Quantification of percent cells divided after no stimulation (left column), photobleaching an ROI containing cytoplasm (cyto, middle column), or an ROI containing mito-KillerRed+ mitochondria (mito, right column). Each data point is the average within a field of view per condition (N=13 experiments). Error bars represent SEM and scale bars are 10 μm. Wilcoxon matched-pairs signed rank test, *p<0.05.