. 2023 Mar 6;12:e85494. doi: 10.7554/eLife.85494

Figure 3. Recipient cancer cells exhibit ERK-dependent proliferation.

(a) ImageStream was used to measure the MFI of an ERK-Kinase Translocation Reporter (ERK-KTR, orange) in the nucleus (DAPI, blue) or cytoplasm of co-cultured 231 cells that did (right) or did not (left) receive mitochondria (green, arrowhead). Below: representative line scans (white dotted lines) of ERK-KTR (orange) and DAPI (blue). (b) Average ERK activity from data displayed in (d) (cytoplasm/nucleus (C/N) mean fluorescence intensity (MFI); N=3 donors indicated as shades of gray). (c) Confocal images of 231 cells expressing ERK-KTR (green) and Mito-KillerRed (magenta) with Hoechst 33342 (blue), after control cytoplasmic bleach (cyto, left) or mito-KillerRed+ bleach (mito, right). Below: representative line scans (white dotted lines) of ERK-KTR (green) and Hoechst (blue). (d) Quantification of ERK-KTR translocation 40 min post-bleach (cyto vs. mito), normalized to time 0. Each dot represents a measurement from a single cell. (e) Analysis of proliferative capacity by quantifying Ki-67 and DNA levels of co-cultured 231 cells treated with vehicle or ERK inhibitor (ERKi) with or without transfer or (f), mitochondrial internalization after mitochondrial bath application (N=3 donors; statistics for G2/M only). Error bars represent SEM and scale bars are 10 µm., Welch’s t-test (b), Mann-Whitney (d), two-way ANOVA (e–f), *p<0.05; **p<0.01; ****p<0.0001.

Figure 3.

Figure 3—figure supplement 1. Amnis ImageStream pipeline for ERK-KTR quantification.

Figure 3—figure supplement 1.

(a) Schematic of ERK-Kinase Translocation Reporter (KTR). When ERK activity is low, the fluorescent protein of the KTR resides primarily in the nucleus (left, dark gray). When ERK activity is high, the fluorescent protein translocates to the cytoplasm (right). (b) Workflow of Amnis ImageStream analyses. Mito-mEm macrophages and ERK-KTR-mRuby 231 cells were co-cultured for 24 hr and then analyzed on the ImageStream. Single cells in focus are selected and populations of interest can be isolated for further analyses. Representative images of recipient cells within our ‘transfer’ gate are displayed in all channels acquired (bottom right images). All populations of interest are then put though two independent readouts of KTR translocation: the pre-built IDEAS Similarity Wizard and/or the custom-built cytoplasmic:nuclear (cyto:nuc) mRuby mean fluorescent intensity masking algorithm. Scale bar is 10µm.
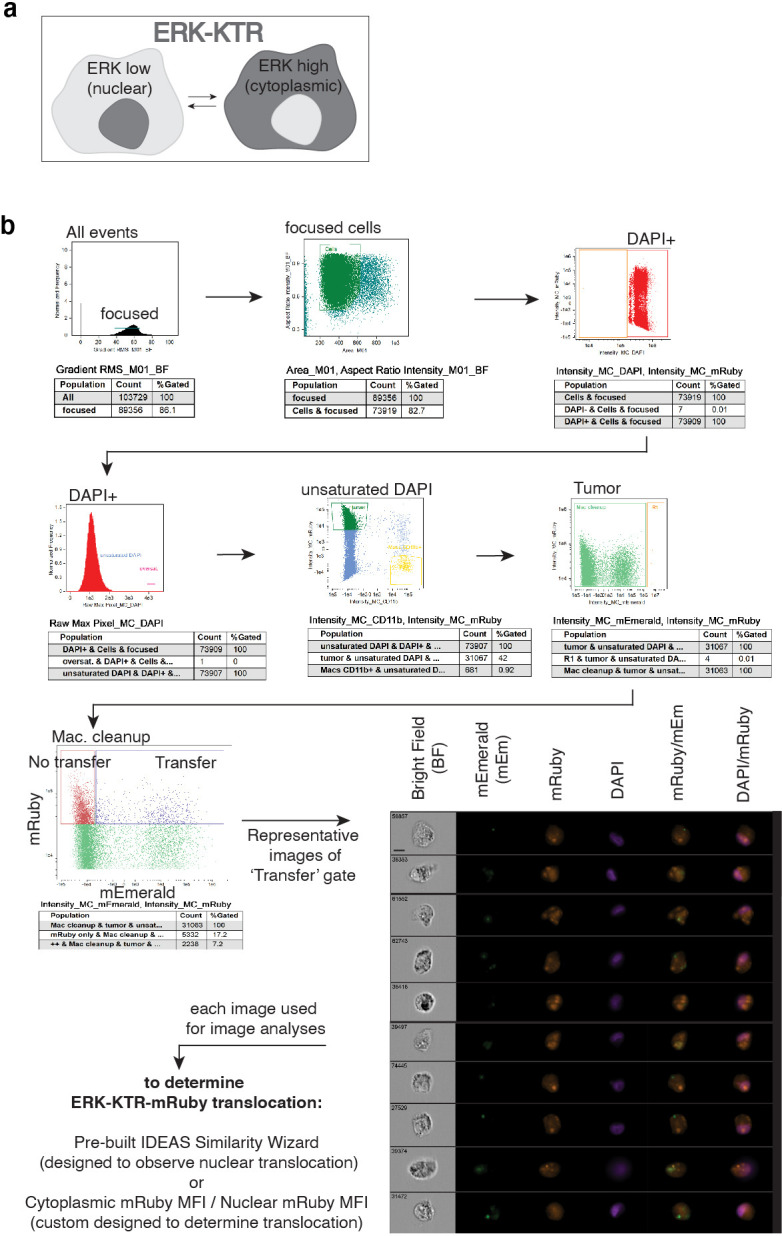
Figure 3—figure supplement 2. ERK-KTR analysis and validation using the Amnis ImageStream pipeline.

Figure 3—figure supplement 2.

(a) Representative ImageStream images using the mRuby mean fluorescence intensity (MFI) masking algorithm to quantify the amount of cytoplasmic cyto (cyto, C) and nuclear (nuc, N) ERK-KTR-mRuby. Representative images of translocated (left) and non-translocated (right) ERK-KTR images are displayed with the ratiometric cyto/nuc values listed below the corresponding images. (b) Representative ImageStream images using the IDEAS Similarity Wizard to quantify how similar ERK-KTR fluorescent signal is to the nuclear signal (DAPI). Representative images are displayed showing examples of translocated (left) and non-translocated (right) images with the ratiometric values listed below the corresponding images. (c) Quantification of ERK-KTR translocation in 231 monocultures using ImageStream after treatment with 1 μM of an ERK inhibitor (ERKi), SCH772984, or an ERK stimulator, Phorbol 12-myristate 12-acetate (PMA). Cyto/Nuc MFI of ERK-KTR (left) and similarity scores (right) for the same data set are displayed (N=1 donor). Scale bars are 10µm. One-way ANOVA, **p<0.01; ****p<0.0001.
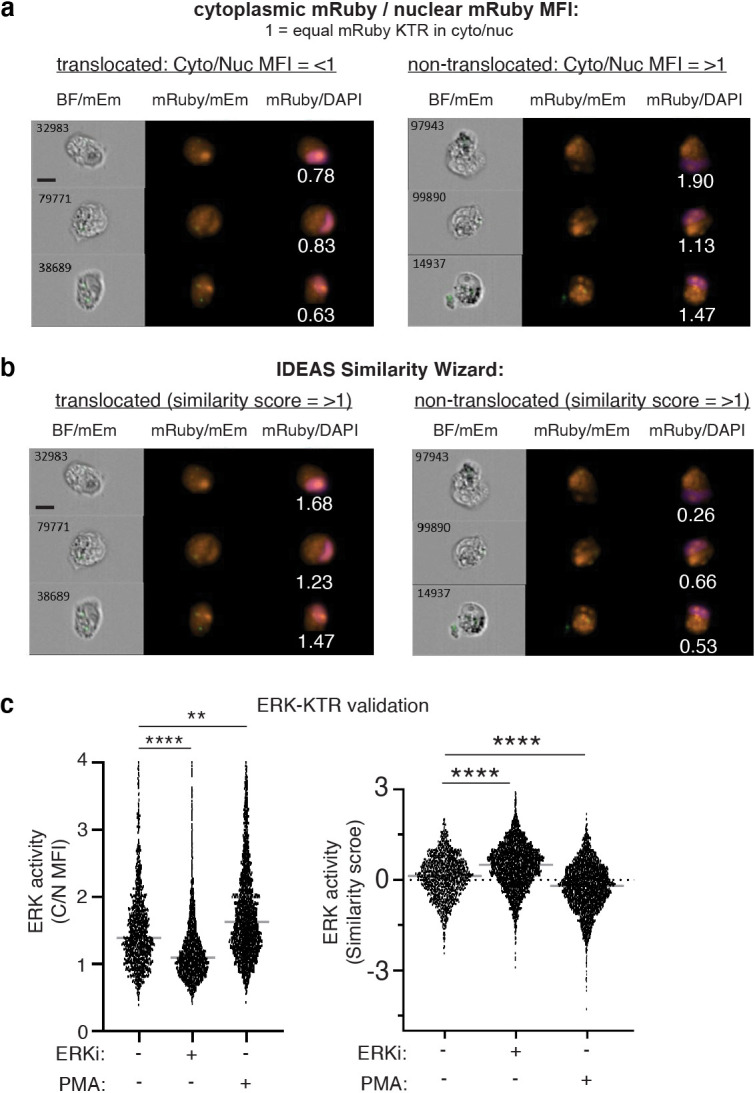
Figure 3—figure supplement 3. Quantification of ERK activity in recipient 231 cells or upon ROS induction.

Figure 3—figure supplement 3.

(a) Cytoplasmic/Nuclear mean fluorescence intensity (C/N MFI) ratios of the ERK-KTR in co-cultured 231 cells are displayed for three different macrophage donors (N=3 experiments). Each data set shows an increase in C/N MFI ratios in recipient cells (left column on each plot) indicating higher ERK activity compared to their non-recipient co-cultured counterparts. (b) The same three experimental samples from the analyses in (a) were analyzed using the IDEAS Similarity Wizard. This analysis indicates cells that receive transfer (right column on each plot) have a lower similarity score, indicating higher ERK activity compared to cells that did not receive transfer (N=3 experiments). (c) Quantification over time of ERK-KTR translocation after mito bleach (black circles) compared to control cyto bleach (gray squares). Welch’s t-test (a–b), Two-way ANOVA at time point 40 min (c), ****p<0.0001.
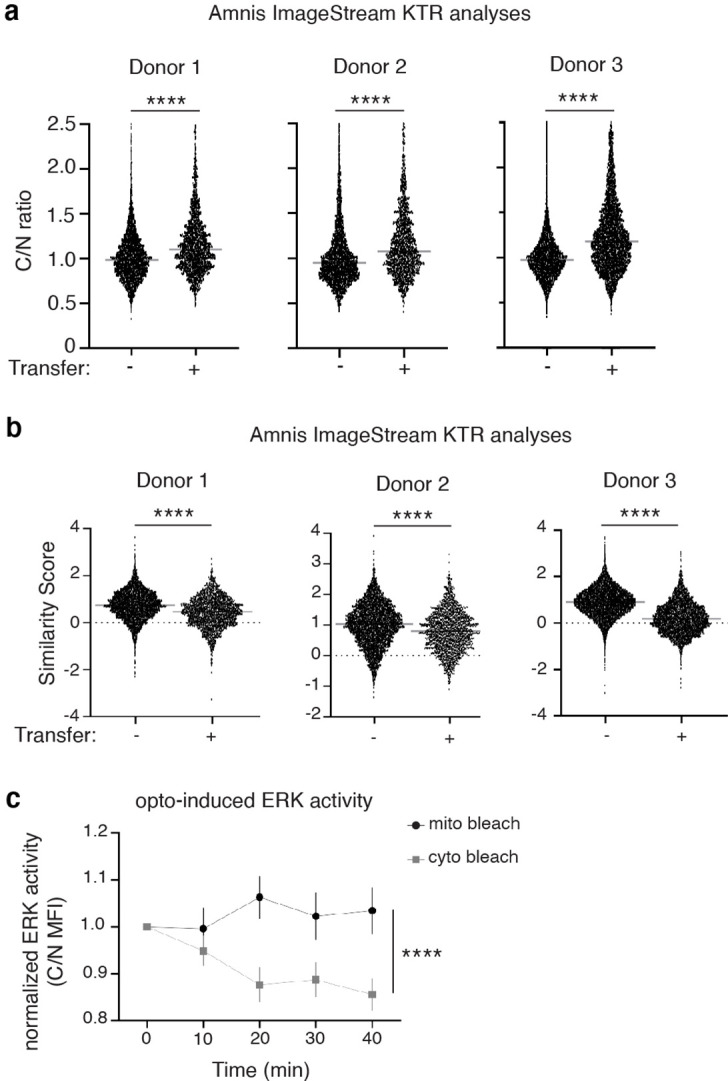
Figure 3—figure supplement 4. ERK inhibition reduces proliferation in cancer cells with macrophage mitochondria.

Figure 3—figure supplement 4.

(a) Co-cultured 231 cells treated with 1 μM ERKi or vehicle at time of plating were analyzed for ERK-KTR translocation. Data are displayed from 3 different macrophage donors (N=3 experiments). Treatment with ERKi significantly reduced the amount of ERK activity in cells that did or did not receive transfer. (b) Average ERK activity from all experiments shown in (a) is displayed (N=3 donors). (c) Co-cultured macrophages and 231 cells were treated with 1 μM ERKi or vehicle at time of plating. Flow cytometry was used to determine how treatment influenced the cell cycle. Plots compare 231 cells that did (right) and did not (left) receive macrophage mitochondria in each stage of the cell cycle treated with vehicle (triangles) or ERKi (circles) (N=3 donors in technical triplicate). (d) Co-cultured 231 cells were treated with ERKi or vehicle at time of plating and the rate of mitochondrial transfer was determined with flow cytometry (N=3 donors in technical triplicate). For all panels, individual donors are indicated as shades of gray and error bars represent SEM. One-way ANOVA (a), two-way ANOVA (b–d), *p<0.05; **p<0.01; ***p<0.001; ****p<0.0001.