. 2023 Mar 6;12:e85494. doi: 10.7554/eLife.85494

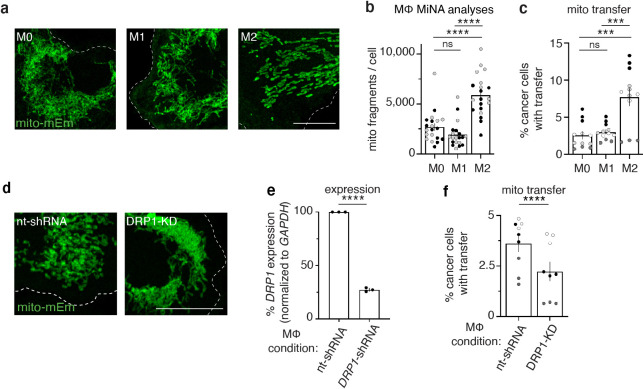
Figure 4. M2-like macrophages exhibit increased mitochondrial fragmentation and increased mitochondrial transfer to cancer cells.

(a) Representative images of mito-mEm+ macrophages that were non-stimulated (M0, left) or activated to become M1-like (middle) or M2-like (right). (b) Mitochondrial network analyses (MiNA) were used to determine number of mitochondrial fragments per cell (N=2 donors). (c) Macrophages were co-cultured with mito-RFP 231 cells for 24 hr and mitochondrial transfer was quantified with flow cytometry (N=4 donors). (d) Representative images of mito-mEm (green) macrophages in macrophages with control nt-shRNA KD and DRP1 KD. (e) q-RT-PCR of DRP1 knockdown (DRP1-KD) macrophages (N=3 donors). (f) Rates of mitochondrial transfer with control and DRP1-knockdown macrophages (N=3 donors). For all panels, individual donors are indicated as shades of gray with each cell as a data point, error bars represent SEM and scale bars are 10 µm. Two-way ANOVA (b, c), unpaired t-test (e, f), ***p<0.001; ****p<0.0001.

Figure 4.

Figure 4—figure supplement 1. M2-like macrophages exhibit increased mitochondrial transfer to cancer cells.
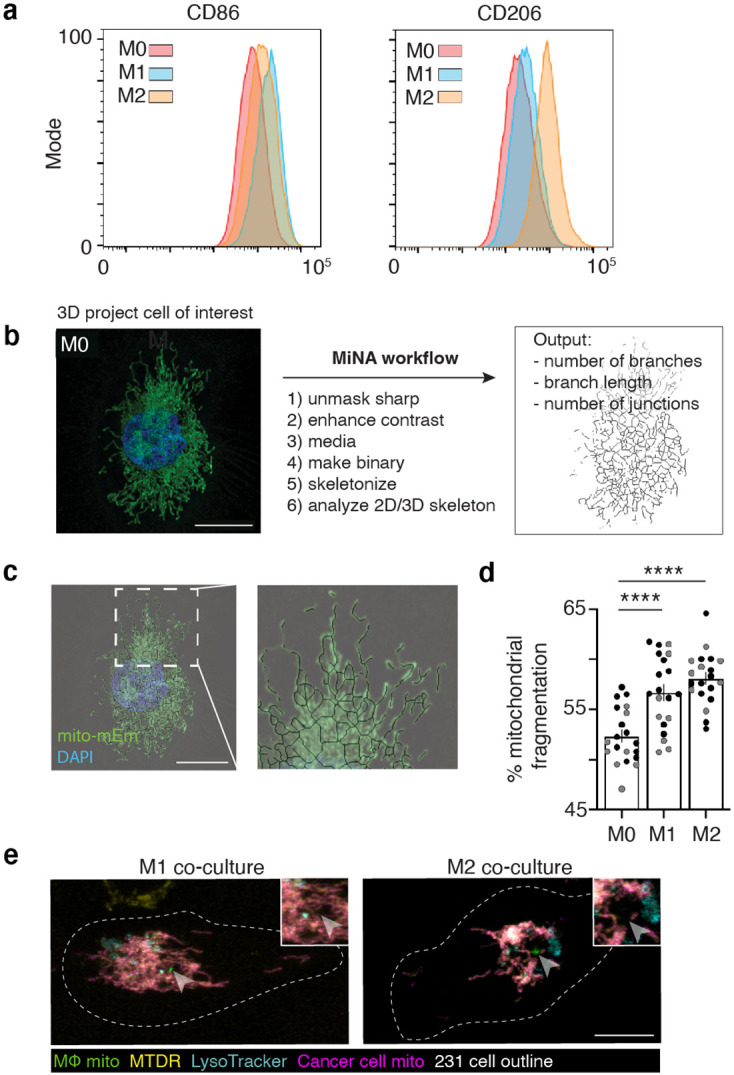
Figure 4—figure supplement 1.

(a) Macrophages were activated with IFN-γ (M1 activation; left) or IL-4/IL-13 (M2 activation; right) for 48 hours and flow cytometry was used to determine expression of canonical M1 (CD86, left) and M2 (CD206, right) markers. Representative histograms shown. (b) Mitochondrial Network Analyses (MiNA) workflow with a representative input confocal image (left) and example of skeletonized mitochondrial network (right) to quantify number of branches per individual mitochondria, branch length, and number of junctions per individual mitochondrion. (c) Representative confocal image with a post-processed skeletonized version of network overlaid. (d) Percent mitochondrial fragmentation in M0, M1-like, and M2-like macrophages (N=2 donors). Two-way ANOVA, ****p<0.0001. (e) Representative confocal images of mito-RFP 231 cells co-cultured with mito-mEm M1-like (left) or M2-like (right) macrophages and stained with MitoTracker Deep Red (MTDR, yellow) and LysoTracker (LT, Teal). 100% of transferred mitochondria (green, arrowhead) from M1-like and M2-like macrophages are MTDR-negative. 63.6% (from M1-like) and 48% (from M2-like) of transferred mitochondria do not co-localize with LT (For M1-like MTDR and LT staining, N=15 cells, 2 donors; for M2-like MTDR staining, N=24 cells, 2 donors; for M2 LT staining, N=17 cells, 2 donors). For all panels, individual donors are indicated as shades of gray, error bars represent SEM and scale bars are 10 μm.
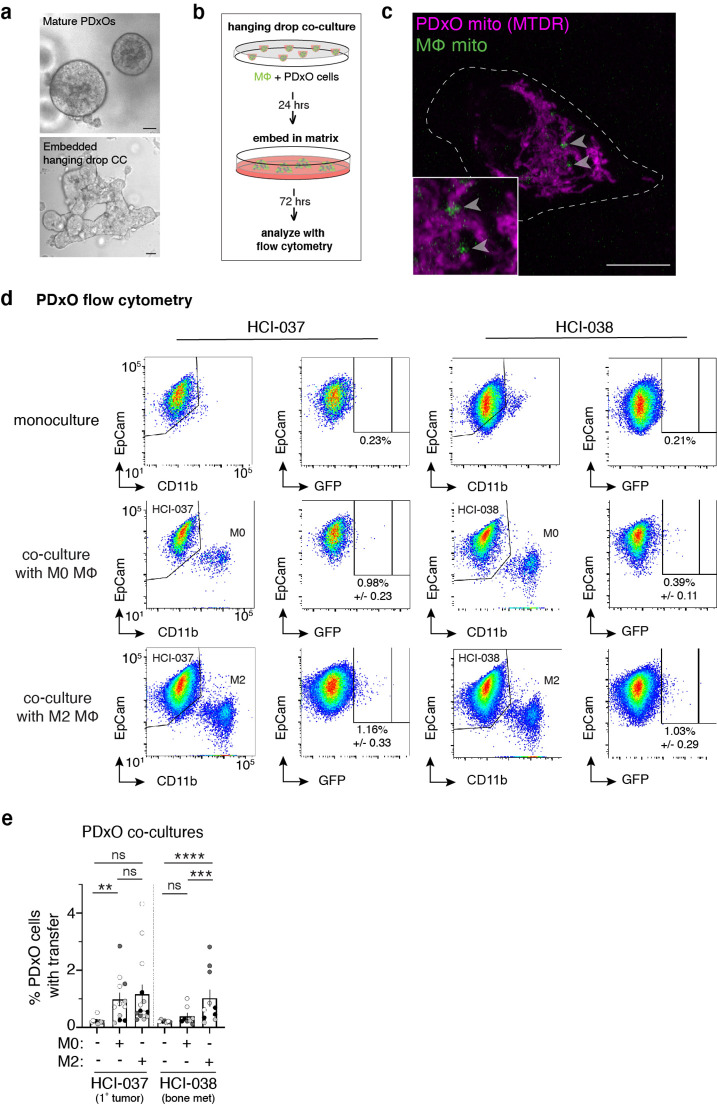
Figure 4—figure supplement 2. Macrophages transfer mitochondria to breast cancer patient-derived cells.

Figure 4—figure supplement 2.

(a) Representative images of the HCI-037 patient-derived xenograft organoid (PDxO) line in culture (top) or an embedded hanging drop co-culture with macrophages (bottom). (b) Schematic of experimental setup of PDxOs (gray)/mito-mEm macrophages (green) co-cultures. Co-cultures are plated in suspended drops of media (hanging drops) to allow for the formation of cell aggregates without adherence to a substrate. After 24 hr, the co-cultured cells are embedded into a matrix (Matrigel) and cultured for 72 hr before analysis with flow cytometry. (c) Representative image of a FACS-isolated PDxO cell containing macrophage mitochondria (green, arrowhead) that are MTDR-negative. (d) Top row: Representative flow cytometry plot of PDxO monocultured cells used as the experimental control when quantifying mitochondrial transfer. Middle row: PDxO cells co-cultured with mito-mEm-expressing M0 macrophages. Bottom row: PDxO cells co-cultured with mito-mEM expressing M2-like macrophages. PDxO lines used for co-culture are indicated at the top of the corresponding panels. Scale bars are 10 μm. (e), Rate of mitochondrial transfer to HCI-037 (left 3 columns) or HCI-038 (right 3 columns) PDxO cells from M0 or M2 macrophages (each dot is one replicate, N=4 donors). Two-way ANOVA, **p<0.01; ***p<0.001; ****p<0.0001.