. 2023 Mar 6;12:e85494. doi: 10.7554/eLife.85494

Figure 5. Macrophage mitochondrial transfer promotes tumor cell proliferation in vivo.

(a) Quantification of E0771 mammary adenocarcinoma cells from in vivo tumors with mKate2+ mitochondria in bone marrow reconstitution experiments versus control mice. N=10 mice per condition. (b) Schematic representation of a second mouse model to quantify proliferation in cancer cells with macrophage mitochondria in vivo. Myeloid lineages were specifically labeled with mito-GFP by crossing a Loxp-Stop-Loxp-MitoTag-GFP mouse to a LysM-Cre mouse. E0771 cells expressing mito-RFP were injected into the mammary fat pad of mice with MitoTag-GFP expression in myeloid cells, and tumors were isolated and analyzed for direct observation of transfer through fluorescent microscopy (c) and Ki67/DNA to quantify proliferative index (d). (c) Representative immunofluorescence image of E0771 tumor cell expressing mito-RFP (magenta) containing GFP+ macrophage mitochondria (arrowheads) from mice in which GFP+ mitochondria are restricted to the myeloid lineage (‘LysM-Cre’). (d) Cell cycle analysis of E0771 in vivo tumor cells with and without GFP+ macrophage mitochondria in ‘LysM-Cre’ model in which GFP+ mitochondria are restricted to the myeloid lineage. N=3 mice. (e) Working model for macrophage mitochondrial transfer to breast cancer cells. For all panels, individual donors are indicated as shades of gray with each cell as a data point, error bars represent SEM and scale bars are 10 µm. Welch’s t- test (a), two-way ANOVA (d), **p<0.01; ****p<0.0001.

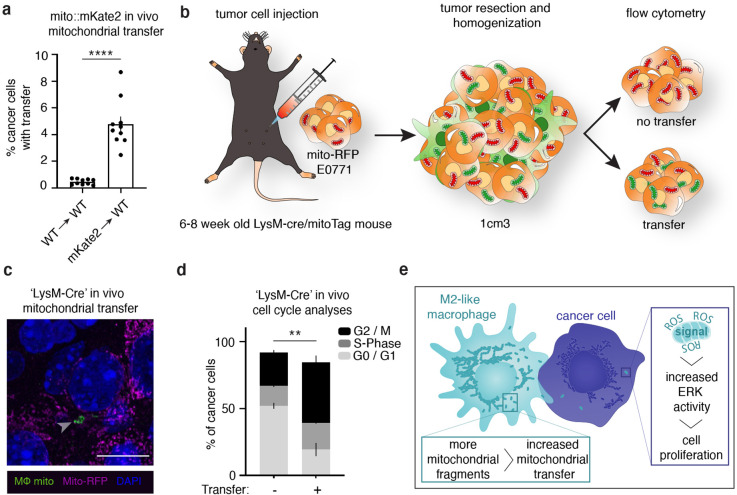
Figure 5.

Figure 5—figure supplement 1. Murine mammary adenocarcinoma cells with macrophage mitochondria exhibit increased cell proliferation in vivo.

Figure 5—figure supplement 1.

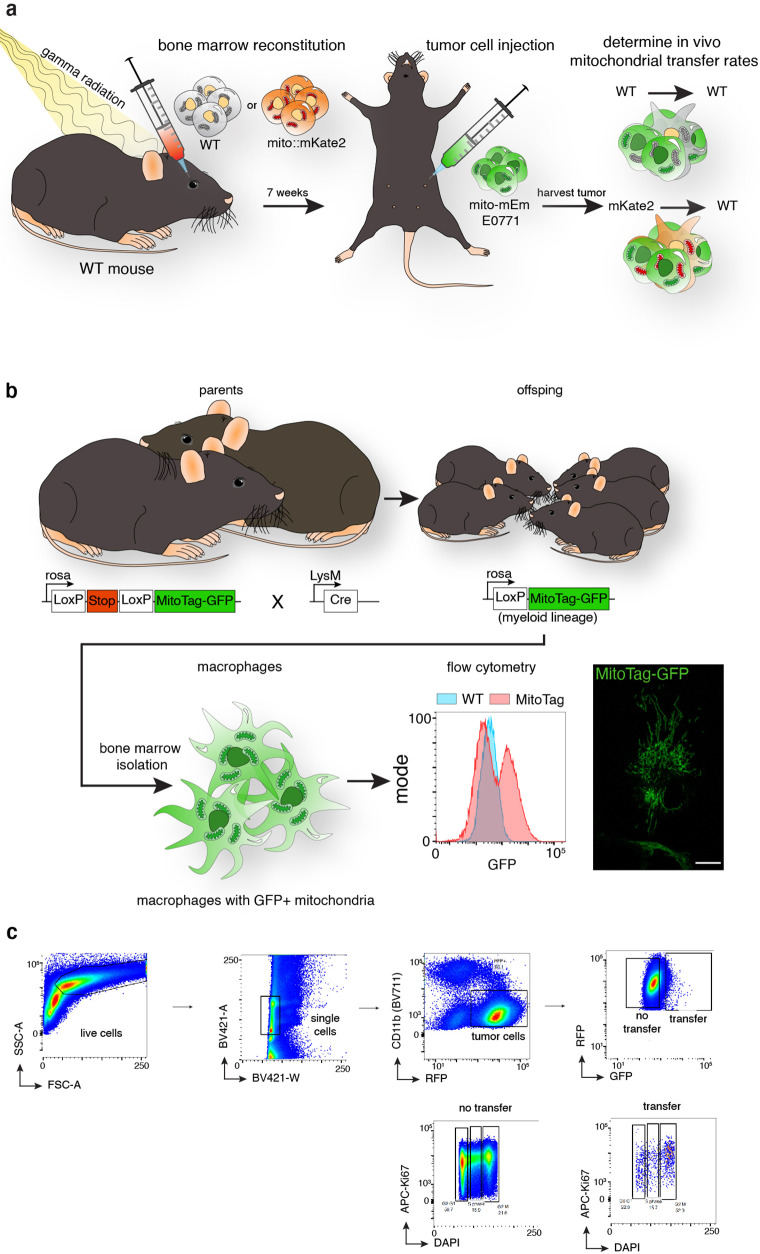
(a) Schematic representation of mouse model to quantify macrophage mitochondrial transfer. Bone marrow from either mito::mKate2 or wildtype mice are transplanted into gamma-irradiated mouse hosts. Once grafted, E0771 cells expressing mito-mEm are injected into the mammary fat pad of these mice, and tumors were isolated and analyzed for mitochondrial transfer by flow cytometry. (b) Schematic representation of a second mouse model to quantify proliferation in cancer cells with macrophage mitochondria in vivo. Myeloid lineages were specifically labeled with mito-GFP by crossing a Loxp-Stop-Loxp-MitoTag-GFP mouse to a LysM-Cre mouse. (c) Gating strategy for Ki67/DNA analysis for E0771 tumors.
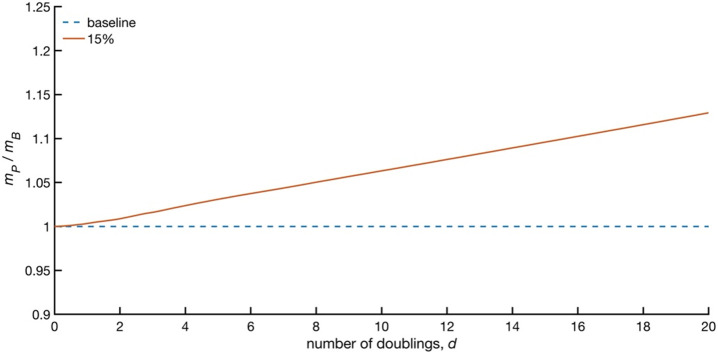
Figure 5—figure supplement 2. Predicted increase in population size due to transferred mitochondria as a function of number of population doublings.

Figure 5—figure supplement 2.

Model results are presented as the ratio of mP, the mass of the population receiving macrophage mitochondria to mB, the mass of the population with baseline growth rate. The initial fraction of cells with transferred mitochondria and the fraction of the population receiving mitochondria, f, over any cell division cycle is assumed to be 5%. 50% of cells lose mitochondria at division. The population was initially seeded with 100 cells and an even distribution of mass between m0 and 2 m0, the baseline initial mass.