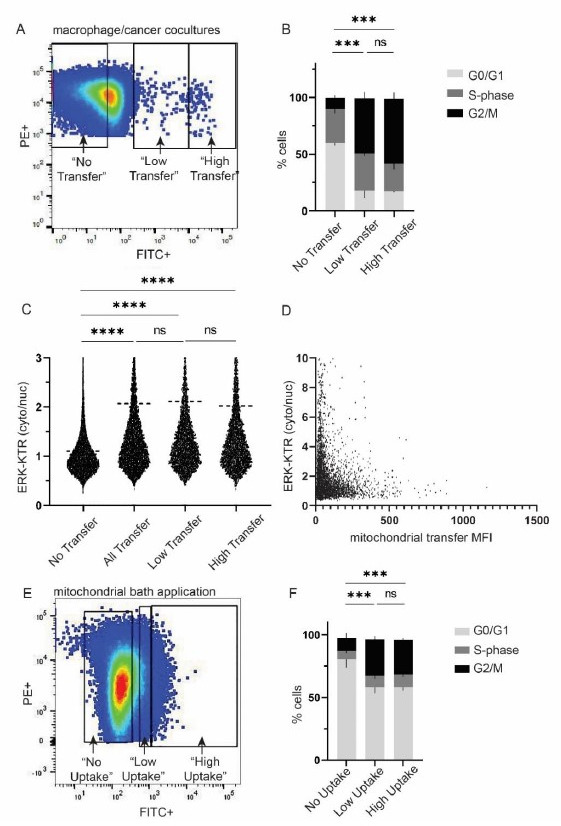
Author response image 3. A.

Representative gating strategy for “low” vs “high” macrophage mitochondrial transfer in macrophage/cancer cell cocultures. B. Cell cycle analysis for populations in (A). 2-way ANOVA, n=2 biological replicates, p<0.001. C. ERK-KTR analysis with imagestream, n=3 biological replicates, 1-way ANOVA, p<0.0001. D. Scatterplot of ERK-KTR and mitochondrial transfer mean fluorescence intensity (MFI). Each dot is a cell. n=7,966 cells. Correlation R2 value: 3.261e-005. E. Representative gating strategy for “low” vs “high” macrophage mitochondrial uptake by cancer cells. F. Cell cycle analysis for populations in (E). 2-way ANOVA, n=3 biological replicates, p<0.001.
