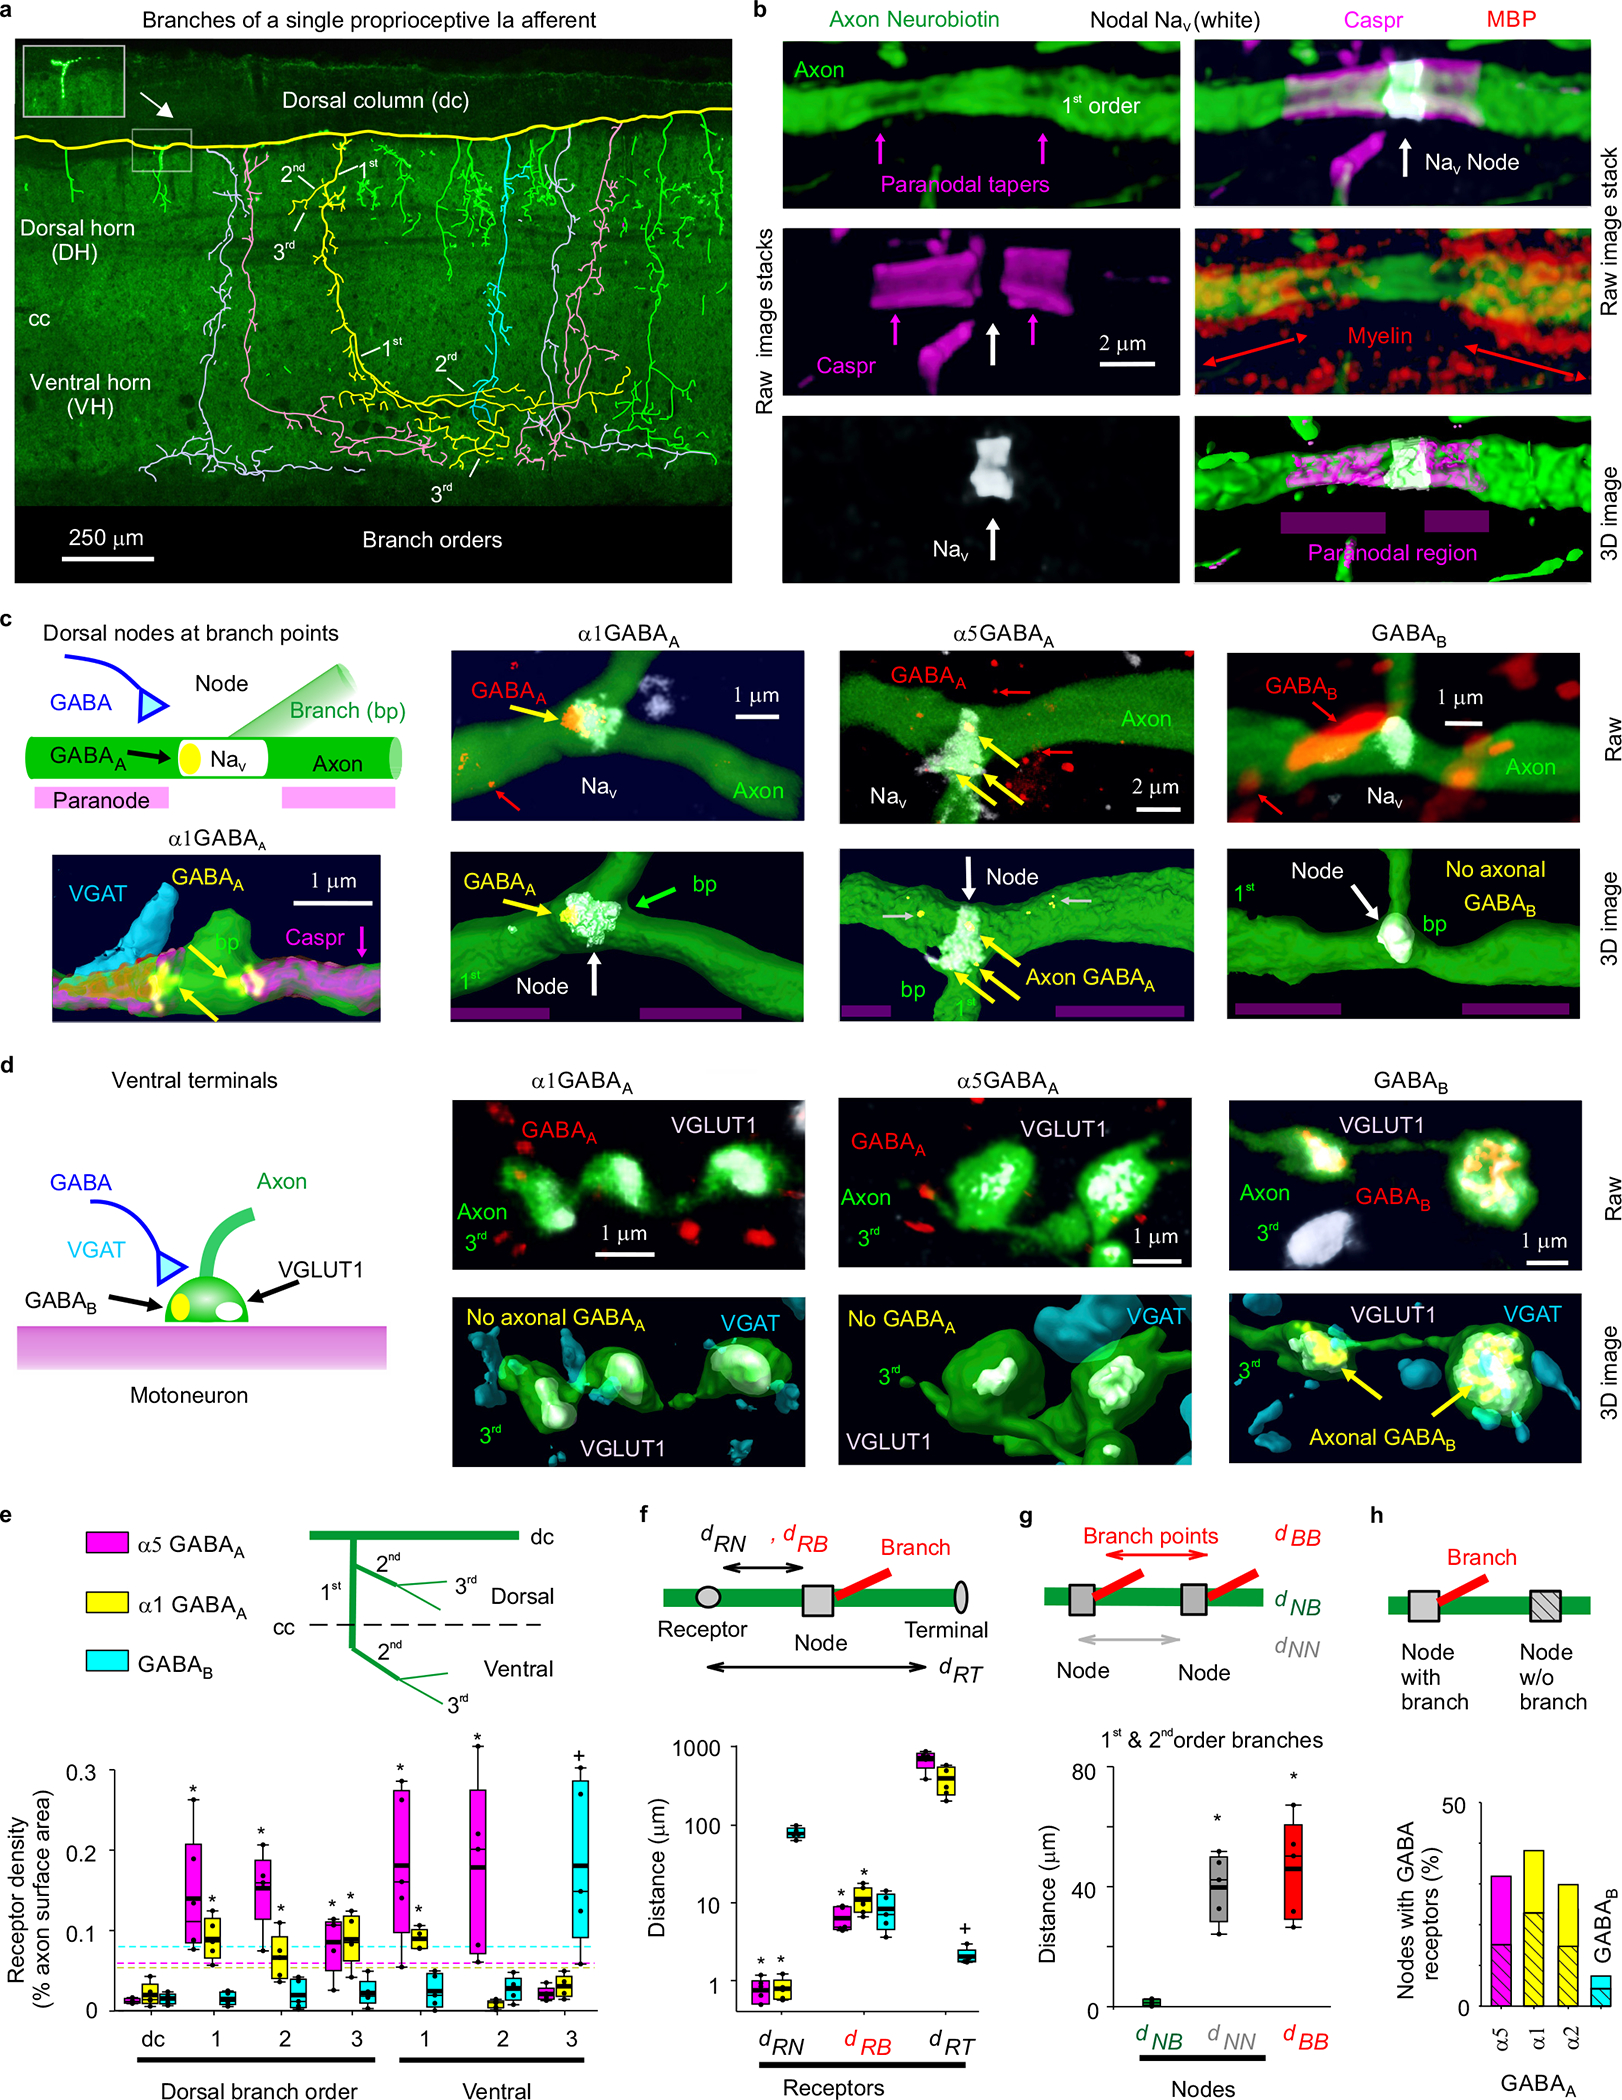
Fig. 1 |. Nodal GABAA and terminal GABAB receptors in rats.

a, Neurobiotin filled proprioceptive Ia axon in the sacrocaudal rat spinal cord (S4 and Ca1), reconstructed from fluorescent images (inset), with branching order indicated and different primary branches distinguished by color. Some ventral branches truncated for clarity (green). Axon diameter not to scale. Central canal: cc. Dorsal columns: dc. Dorsal and ventral horns: DH and VH. b, Node on axon branch in DH immunolabelled for sodium channels (NaV), paranodal Caspr and myelin (MBP), shown with raw images (maximum projection of z-stack), with the paranodal taper indicated, and co-labelling within the axon rendered in 3D (bottom). 1st order branch in DH. c-d, α1 GABAA, α5 GABAA and GABAB receptor immunolabelling in axon branches (raw maximum projection: top row, 3D reconstruction: bottom), with all receptors colocalized with the axon labelled yellow. Receptor clusters specifically in the axon membrane indicated with yellow arrows. Some α5 GABAA receptors are in axon cytoplasm (yellow with gray arrow) or in nearby neurons (red), and not in axon membrane. In (c) nodes identified by NaV (or Caspr) and paranodal taper, and located at branch points (bp, 1st to 2nd bp in DH). In (d) ventral terminal boutons identified by vesicular glutamate transporter 1 (VGLUT1) adjacent to motoneurons. GABAergic contacts identified by vesicular inhibitory amino acid transporter (VGAT). (a-d) representative of 5 rats. e, Receptor densities on axon branches of varying order in dorsal (dorsal and intermediate laminae) and ventral regions. Box plots show the interquartile range (box), median (thin line), mean (thick line), 10 and 90 percentile (whiskers) and extremes (dots). Dashed lines: lower confidence interval, 1 SD below mean maximum density. *significantly more than ventral terminal (3rd order) receptor density, + ventral terminal receptor density significantly more than 1st or 2nd order branch densities, two-sided unpaired t- test, P < 0.05, n = 5 rats each, with 11, 17 and 12 independently filled and reconstructed axons for α1 GABAA, α5 GABAA and GABAB receptors, respectively. f, Distances from GABA receptor clusters in the membrane to nodes (dRN, NaV), branch points (dRB) or ventral terminals at motoneurons (dRT). Distances to 1st and 2nd order dorsal and ventral nodes similar and pooled, as were branch points. *significantly less than dRT. + significantly less than dRN and dRB; one-way ANOVA with Bonferroni correction, P < 0.05, n = 5 rats, with 89, 36 and 70 clusters for α1 GABAA, α5 GABAA and GABAB, respectively. g, Distances between branch points (dBB), nodes (NaV clusters, dNN), and branch points and their nearest node (dNB) for 1st and 2nd order branches. On dorsal columns dNN = 243 ± 117 μm. *significantly larger than dNB; one-way ANOVA with post Bonferroni correction, P < 0.05, n = 5 rats, same axons as (e), with 95 nodes and 57 bp. h, Proportion of nodes with GABA receptors, with and without (hashed) nearby branch points; n = 5 rats each, with 86, 75, 91, and 103 nodes for α5, α1, α2 GABAA and GABAB receptors, respectively.
