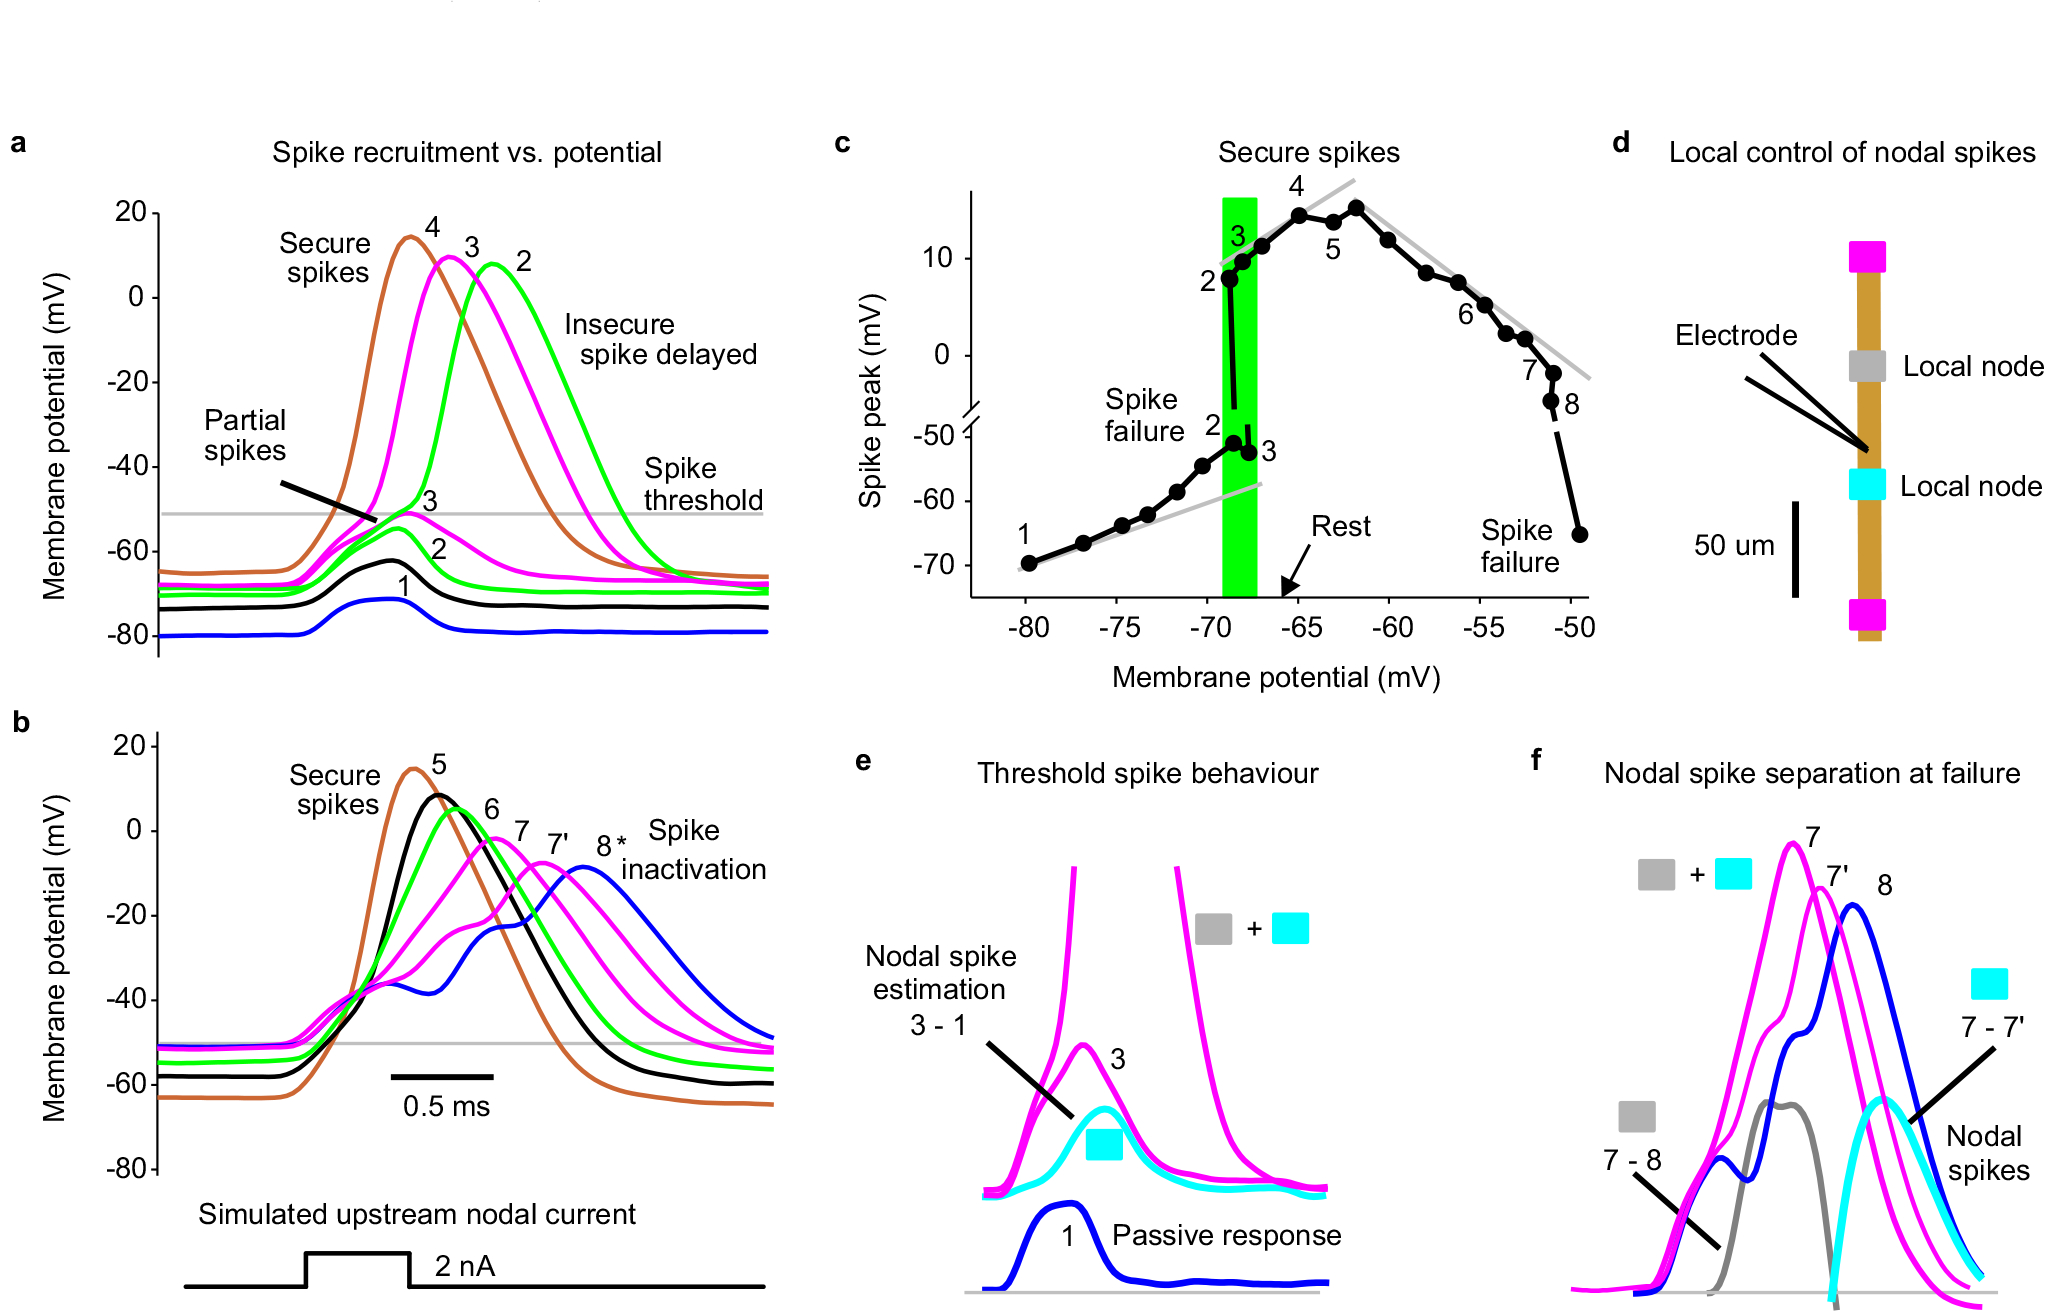
Extended Data Fig. 3 |. Voltage dependence of spike failure with simulated nodal currents.

Simulating spike propagation failure in a proprioceptive axon by applying a brief intracellular current injection to mimic the current arriving from an upstream node (and FP), yielded full spikes evoked at rest, but nearby nodal spikes delayed and then failing as the membrane was held progressively more hyperpolarized with a steady bias current. Also, large steady depolarizations inactivated these spikes, though well outside of the physiological range (> −50 mV). a, Intracellular recording from proprioceptive Ia afferent branch in the rat dorsal horn (sacral S4 axon). A brief current injection pulse (0.5 ms) was applied to simulate the current arriving from distal nodes during normal axon spike conduction, and repeated at 1s intervals. During these pulses the membrane was held at varying potentials for 1 – 2 s with steady current injection, with numbers and colours denoting a given holding potential (in DCC mode). At the most hyperpolarized levels spikes failed to be evoked and only the passive response is seen, like a FP (blue, 1). As the potential was depolarized to near the axon’s resting potential (−67 mV) partial spikes occurred (green, 2 and 3), likely from a single adjacent node activating, and then delayed broad spikes occurred, as both adjacent nodes were activated. At more depolarized levels the spikes arose more rapidly and increased in height to full secure spikes (4). b, In the same axon as (a), at holding potentials well above those seen physiologically (near −50 mV, lower plots) spikes started to exhibit sodium channel inactivation and failure, with a decrease in spike height and delay (7 – 8) and eventually full failure (shown in c). Adjacent nodes started failing at slightly different times with different delays, broadening the spike and eventually separating into two distinct nodal spikes (8*). c, Spike heights plotted as a function of holding potential, including those spikes illustrated in (a and b), with spike number-labels indicated. Left grey line indicates passive leak current response, and shows deviation from passive response near rest. Shaded green region shows all or nothing failure or spikes near the resting potential. Middle grey line shows a region of secure spikes with relatively invariant spikes. Right grey line shows spike inactivation with large depolarizations and outright failure near - 50 mV. Note the split vertical axis. Similar voltage dependence of spike failure occurred for n = 5/5 axons showed similar results, from 4 rats. This demonstrates two modes of spike failure: 1) spikes that fail at rest or at hyperpolarized potentials and 2) spikes that fail with large depolarizations above rest. The latter is likely not physiological, since even the largest PAD that we have observed (5 – 10 mV; Fig. 4d) does not depolarize axons to −50 mV, since axons rest near −70 mV, and PAD is only large at hyperpolarized levels (Fig. 4d) and decreases steeply as the potential approaches the reversal potential for chloride (−15 mV)15. d, Schematic of recording arrangement and relation to adjacent nodes for data in (e) and (f). e, Expansion of responses 1 (blue) and 3 (pink) from (a), and difference (cyan) to show the first local nodal spike height at threshold, recorded at electrode. Active nodes from schematic in (d) shown with shaded boxes. f, Spikes near sodium inactivation from (b) (7 and 8), with differences indicating local nodal spikes (grey: 7 – 8, and cyan: 7 – 7’, both truncated to only show estimated nodal spike). Nodes likely arranged as in (d).
