
Figure 1.
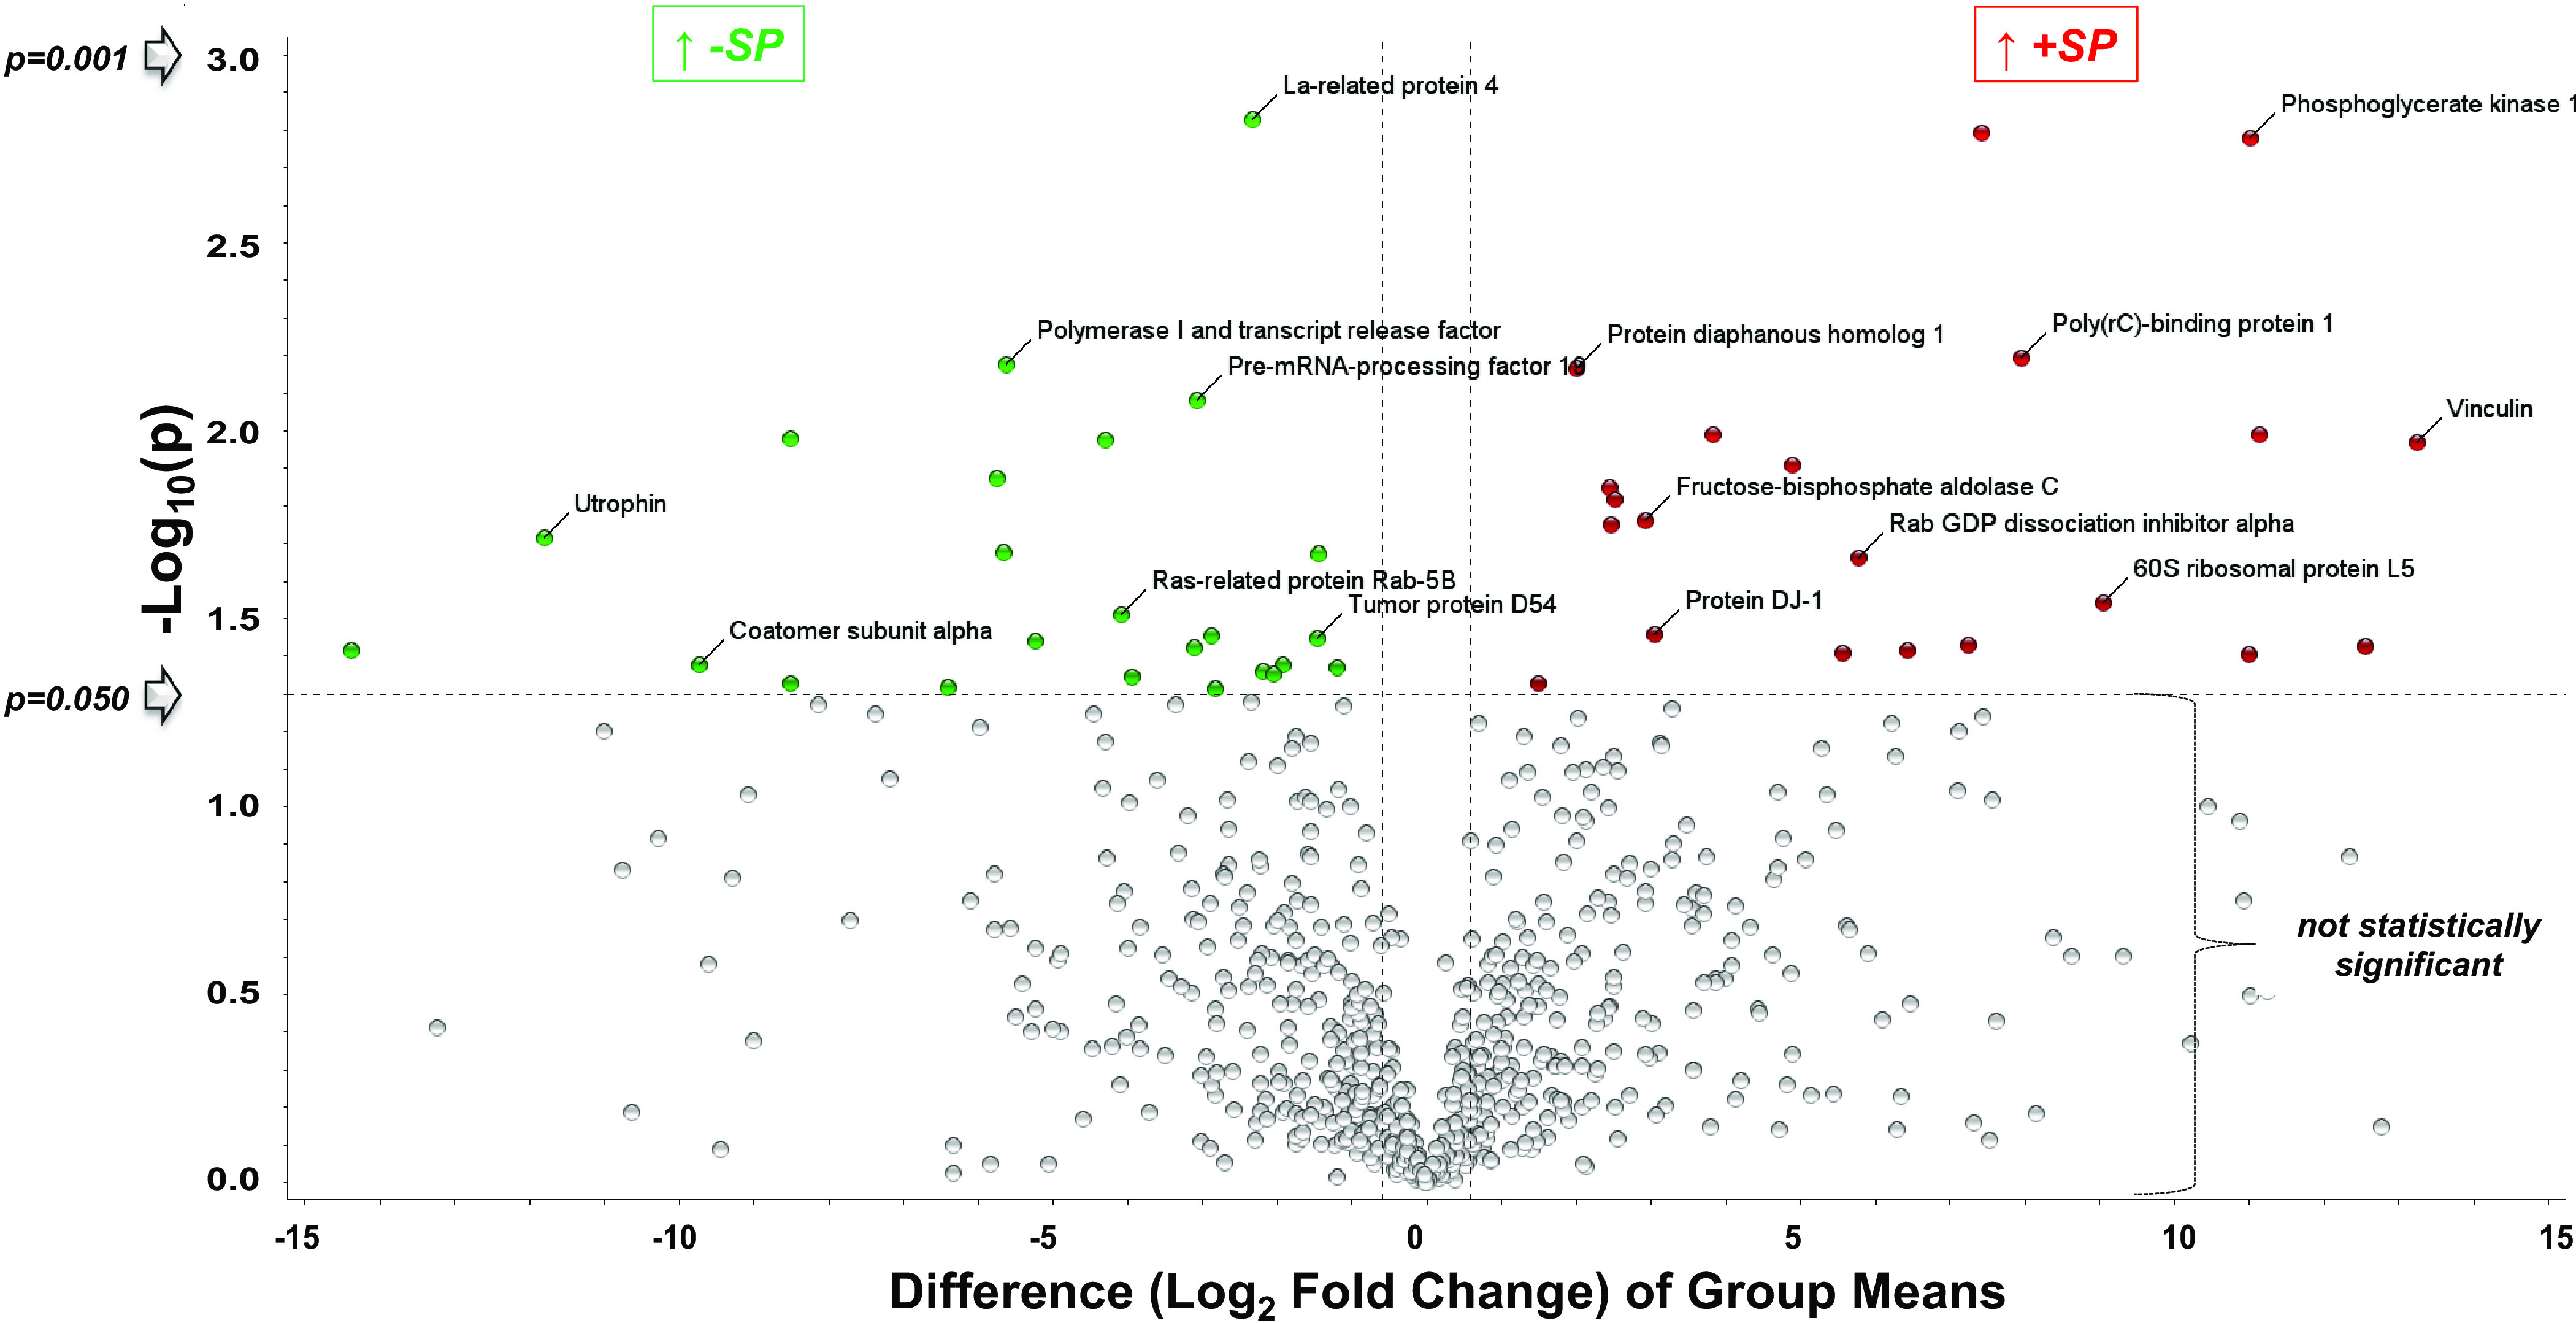
Volcano plot of proteins increased or decreased in abundance following addition of S1 vs. vehicle 24 h later. Ninety-nine proteins were significantly changed in abundance by S1 treatment, 51 of which increased (Table 1), and 48 decreased (Table 2). The y-axis is the negative log (base 10) of the P value. This results in highly significant points with low P values appearing toward the top of the plot. The log of the fold change between the two conditions is plotted on the x-axis in base 2 (ex: Log2 Fold 35 = 5). Points found toward the top of the plot that are either on the left- or right-hand sides represent values that display large-magnitude fold changes as well as high statistical significance. Values are means of four different experiments.