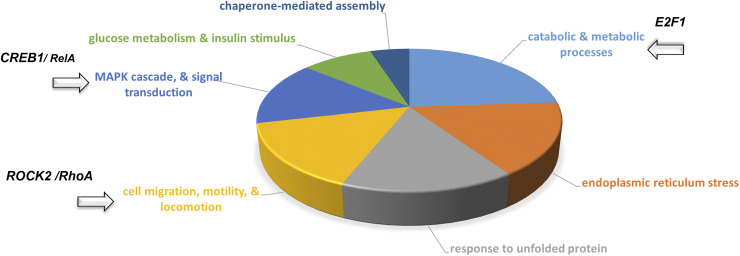
Figure 3.
Top process networks pie chart from systems biology analysis carried out on the most significantly changed proteins (Tables 1 and 2), from rat L2 cells 24 h after treatment with SARS-CoV-2 S1 or vehicle. Highlighted segments contain proteins associated with ROCK2/RhoA (cell migration, motility, and locomotion), CREB1/RelA (MAPK cascade, signal transduction), and E2F1 (catabolic and metabolic processes).

