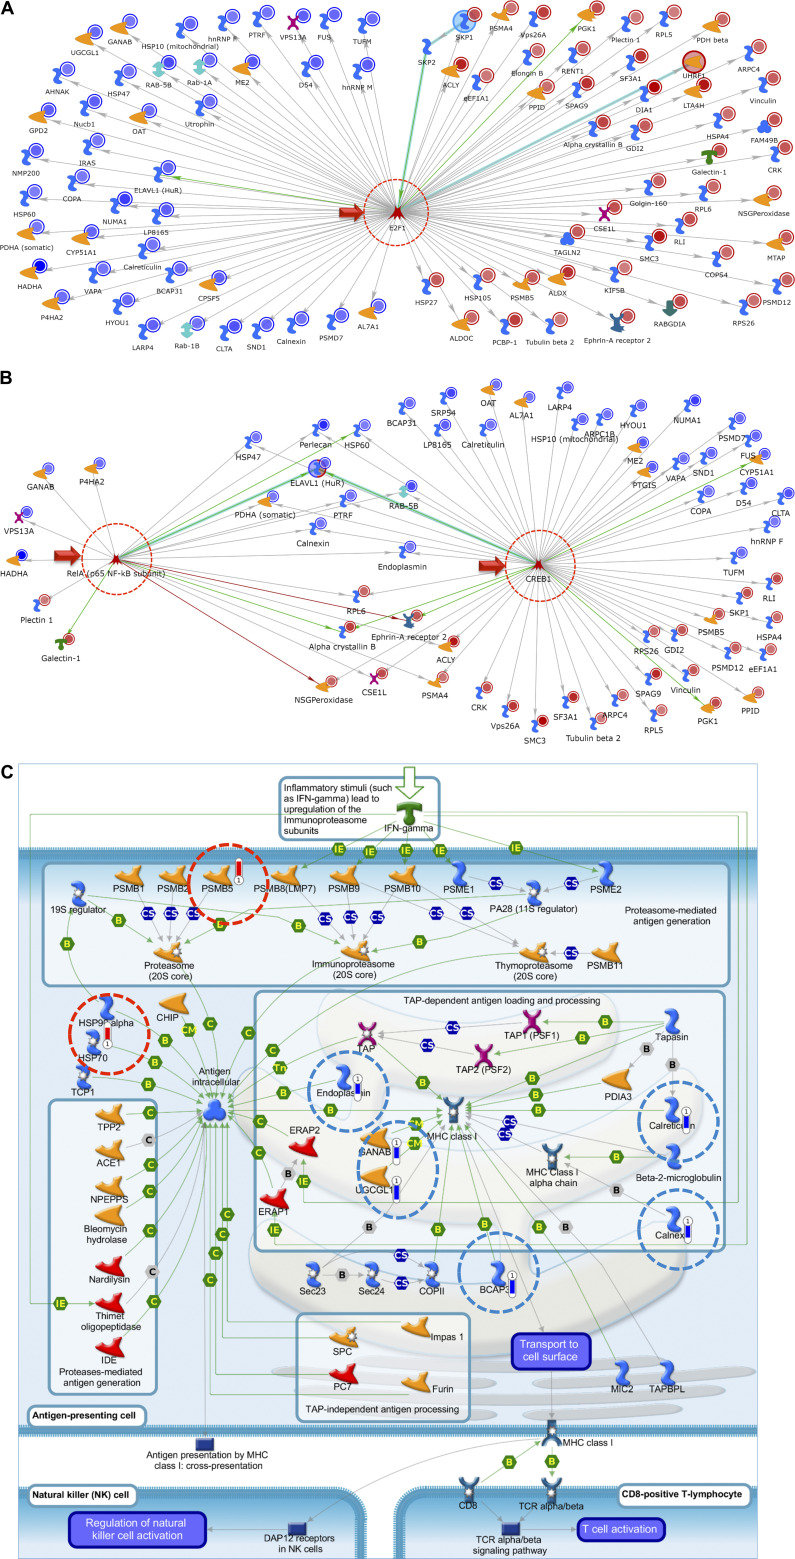
Figure 4.
Top network map with the use of the 99 most significantly changed proteins at 24 h post-S1 identified in Tables 1 and 2, using Metacore’s Systems Biology software to carry out network analysis. E2F1 (A) and ReA/p65, NF-κB (B) were identified as a major centralized network hub. Nearly the entire list of proteins identified were shown to interact/associate in some way with E2F1 as a direct results of treatment of L2 cells with SARS-CoV-2 S1 protein for 24 h. Top network map for SPIKE S1 treatment; RelA and CREB1 presented as minor and major network hubs, respectively. Blue circles indicate a decrease, whereas red circles indicate an increase in protein abundance at 24 h postincubation with S1 as compared to vehicle. Detailed description of all symbols is shown in Supplemental Fig. S1. C: top pathway map for SPIKE S1 treatment: immune response-antigen presentation by major histocompatibility (MHC) class I, classical pathway. Blue bars indicate a decrease and red bars indicate an increase in protein abundance 24 h post-S1 incubation compared to vehicle control.

