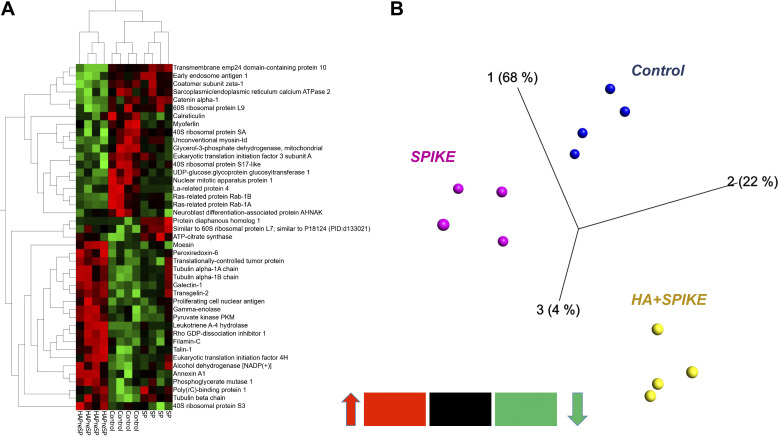
Figure 5.
Heat map (A) and three-dimensional (3-D) PCA plot of control (vehicle; B) vs. S1 (SPIKE), and HMW-HA pretreatment prior to S1 treatment of rat L2 cells, stemming from the most significant protein differences by ANOVA (analysis of variance) using the data matrix from Table 4. Each column represents a different experiment. Note the tight grouping of the various experiments in the 3-D PCA plot (each point represents a different experiment). HA, hyaluronan (hyaluronic acid); HMW, high molecular weight; PCA, principal component analysis.

