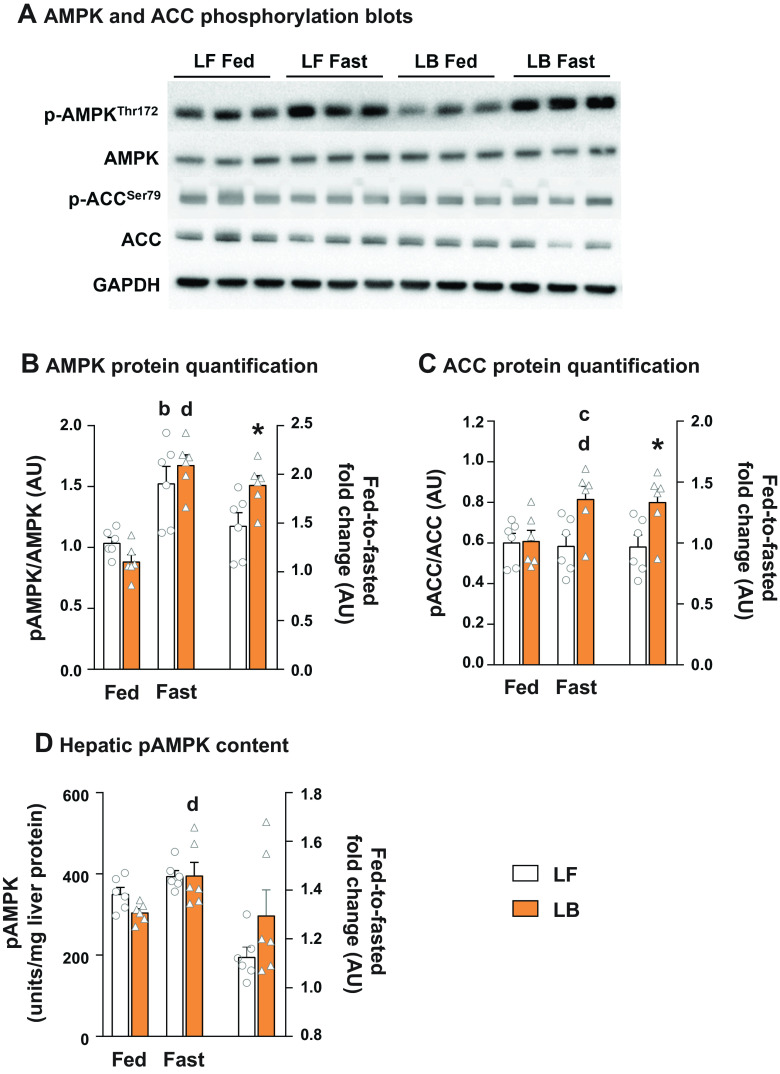
Figure 7.
Phosphorylation of AMPK and ACC in livers of BCAA-supplemented mice. A: Western blot images of pAMPKThr172, AMPK, pACCSer79 and ACC in LF and LB livers. B: quantification of p-AMPKThr172: AMPK and fed-to-fasted fold-changes in phosphorylation. C: quantification of p-ACCSer79: ACC and fed-to-fasted fold-changes in phosphorylation. D: hepatic p-AMPK levels and fed-to-fasted fold-changes in p-AMPK content determined by ELISA on liver tissue from LF and LB mice. All the values are represented as means ± SE, with n = 6/group. Results are considered significant at P ≤ 0.05 following two-way ANOVA, followed by pairwise mean comparisons represented by the following alphabets: “b”—LF Fed vs. LF Fast; “c”—LF Fast vs. LB Fast; “d”—LB Fed vs. LB Fast. Comparisons with a symbol “*” represents a Student’s t test with a P ≤ 0.05. AU, arbitrary units; BCAA, branched-chain amino acid; HB, high-fat diet with BCAA; HF, high-fat diet; LB, low-fat diet with BCAA; LF, low-fat diet.

