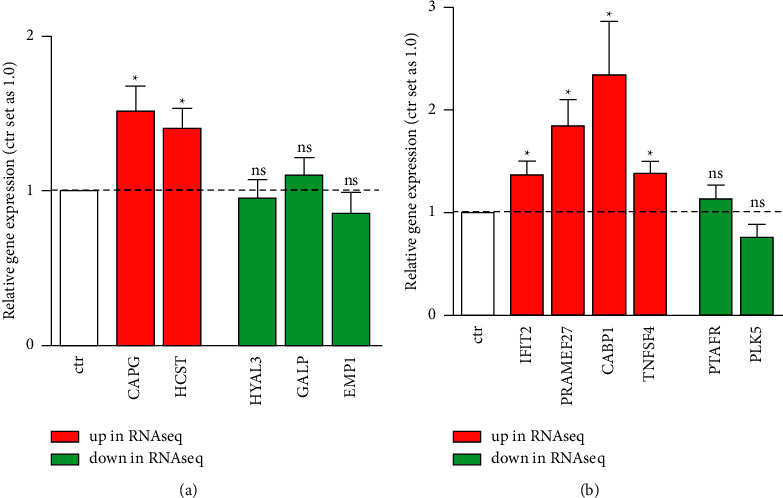
Figure 11.

Validation of differentially expressed genes identified by RNAseq analysis after INPP4B overexpression in Y79-Etop (a) and RB355-Etop (b) RB cells. Quantitative real-time PCR verified the significant upregulation of CAPG, HCST, IFIT2, PRAMEF27, CABP1, and TNFSF4 (red bars) after INPP4B overexpression. Downregulation of the genes HYAL3, GALP, EMP1, PTAFR, and PLK5 did not reach significance (green bars). All experiments were performed at least in triplicates and results depicted with a standard error of the mean (SEM). A student's t-test was used to calculate statistical differences (∗p value <0.05) between control and experimental groups.
