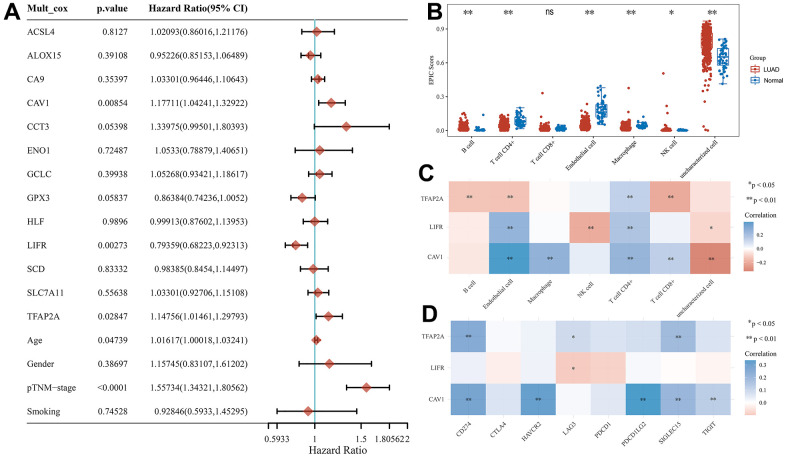
Figure 6.
Potential prognostic biomarkers acquisition and immunoassay for CRFG in LUAD. (A) Multifactorial Cox regression analysis of CRFGs and associated clinical characteristics. (B) Immune scores in LUAD and normal tissues, the horizontal coordinate represents the types of immune cell infiltration and the vertical coordinate represents the distribution of immune scores in the two groups. (C) Heat map of correlation between potential prognostic biomarkers and immune scores, horizontal coordinates represent the type of immune cell infiltration, vertical coordinates represent genes. (D) Heat map of the correlation between the potential prognostic biomarkers and common immune checkpoints, horizontal coordinates represent immune checkpoints and vertical coordinates represent biomarkers.

