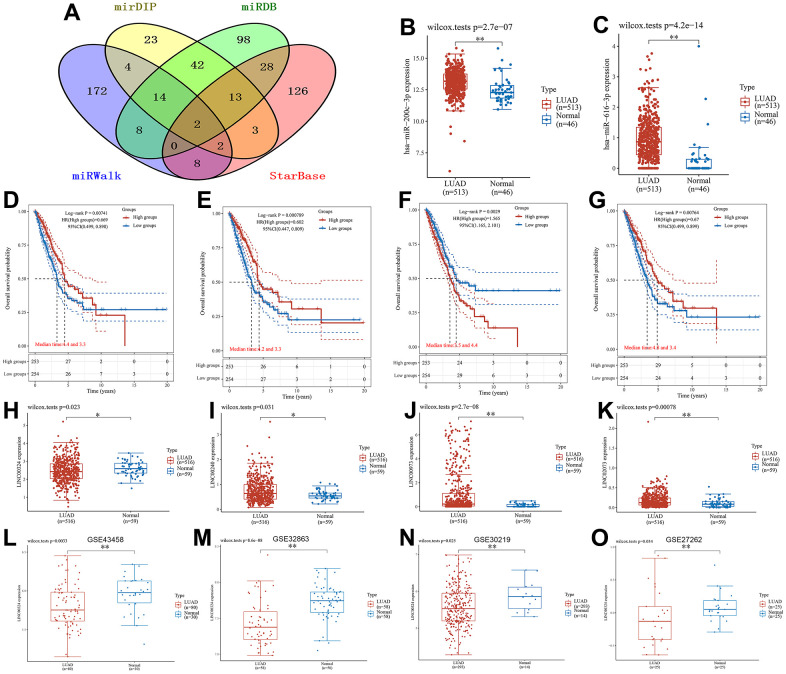
Figure 8.
Results of the lncRNA-related regulatory axis. (A) Venn diagram using data from four databases: mirDIP, miRDB, miRWalk and StarBase. (B) Differential expression of miR-200c-3p, (C) miR-616-3p in LUAD samples and normal samples. Relationship between (D) LINC00324, (E) LINC00240, (F) LINC00973 and (G) LINC02073 expression levels and OS. Box plot of differential gene expression between (H) LINC00324, (I) LINC00240, (J) LINC00973, (K) LINC02073 in LUAD samples and normal samples. External dataset validation of expression differences of LINC00324. (L) GSE43458; (M) GSE32863; (N) GSE30219; (O) GSE27262.

