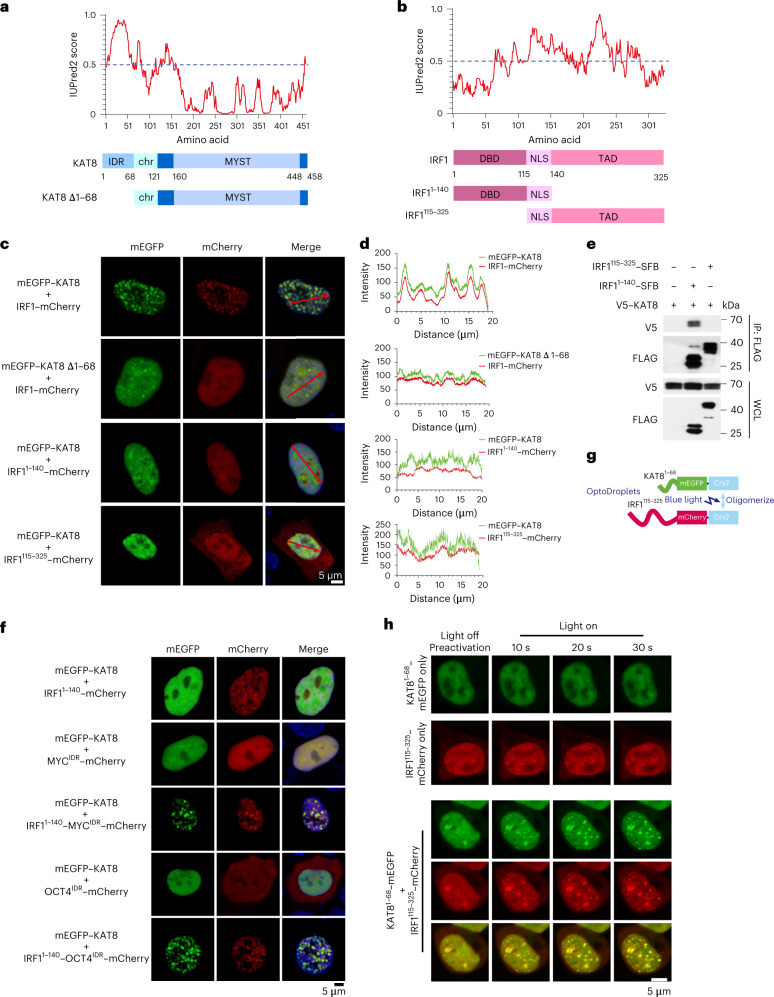
Fig. 3. KAT8–IRF1 condensation depends on both structured domain and IDR interactions.
a,b, Protein structure and IDR analysis of KAT8 (a) and IRF1 (b) using the IUPred2A tool with default parameters. Scores above 0.5 indicate disorder. The representative diagrams indicating the major domains of full-length KAT8 and IRF1 and the truncated constructs are shown below; TAD, transactivation domain; NLS, nuclear localization signal; chr, chromodomain; MYST (Moz, Ybf2/Sas3, Sas2, Tip60) acetyltransferase domain. c,d, Confocal microscopy images of condensate formation in 143B cells cotransfected with the indicated constructs (c). Line scan analysis results of fluorescence intensity along the indicated lines in c are shown (d). e, HEK293T cells were cotransfected with V5–KAT8 and the indicated IRF1–SFB truncated constructs. SFB-tagged proteins were immunoprecipitated with anti-FLAG beads and immunoblotted with anti-V5 or anti-FLAG; WCL, whole-cell lysate. f, Confocal microscopy images of representative 143B cells cotransfected with mEGFP–KAT8 and the indicated constructs. g, Schematic illustration of the optoDroplets assay. h, HEK293T cells were transfected with IRF1115–325–mCherry–Cry2 and KAT81–68–mEGFP–Cry2 separately or together. Images were collected at the indicated times after illumination by a 488-nm laser. The experiments in c, e, f and h were repeated three times with similar results.

