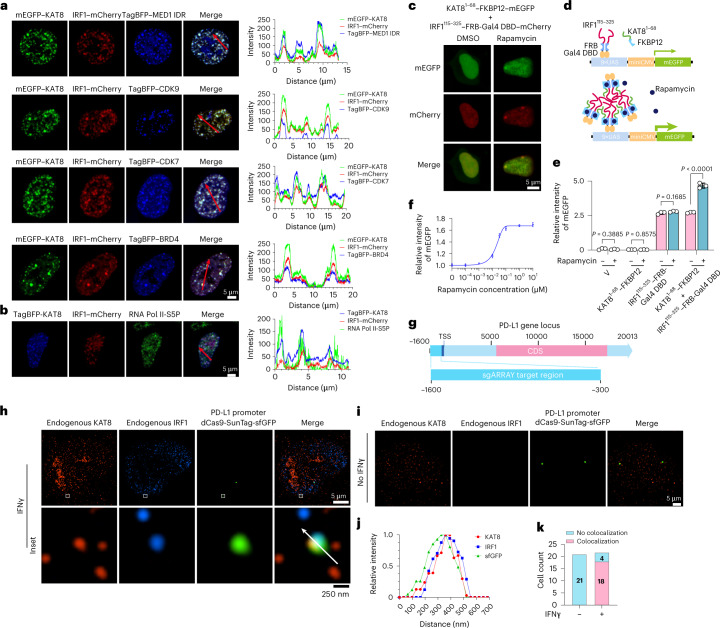
Fig. 4. KAT8 and IRF1 condensates enrich the transcription apparatus and colocalize with the PD-L1 promoter to promote transactivation.
a,b, Confocal microscopy images of representative condensates in 143B cells cotransfected with the indicated constructs (a) and stained with the indicated antibodies (b). The corresponding line scan analyses are plotted on the right. c, Confocal microscopy images of HEK293T cells with KAT81–68–FKBP12–mEGFP and IRF1115–325–FRB-Gal4 DBD–mCherry cotransfected and treated with or without rapamycin (200 nM) for 1 h. d, Schematic illustration of the Gal4 reporter assay. e, 143B cells integrated with Gal4-UAS–mEGFP reporter were transfected with the indicated vectors and treated with DMSO or rapamycin (200 nM) for 18 h before analysis by FACS. f, IRF1115–325–FRB-Gal4 DBD and KAT81–68–FKBP12 stably integrated UAS–mEGFP reporter cells were treated with the indicated concentrations of rapamycin for 24 h, and mEGFP signal intensity was quantified by FACS. g–k, In situ analysis of the colocalization of endogenous KAT8 and IRF1 with the PD-L1 promoter region by SIM; 143B cells were transfected with a set of dCas9-SunTag-sfGFP and sgARRAY vectors to visualize the PD-L1 promoter region (Methods). A schematic of the PD-L1 promoter region targeted by sgARRAY is shown (g). After treatment with (h) or without (i) IFNγ for 6 h, 143B cells were stained with anti-KAT8 and anti-IRF1. The corresponding line scan analyses are shown in j. Cells with positive or negative localization of KAT8–IRF1 droplets at the sfGFP sites were counted in the presence or absence of 100 U ml–1 IFNγ treatment for 6 h (k); TSS, transcription start site; CDS, coding sequence. P values in e were calculated by two-tailed Student’s t-tests. Error bars in e and f indicate the mean ± s.d.; n = 3 biologically independent experiments. The experiments in a–c, h and i were repeated three times with similar results.

