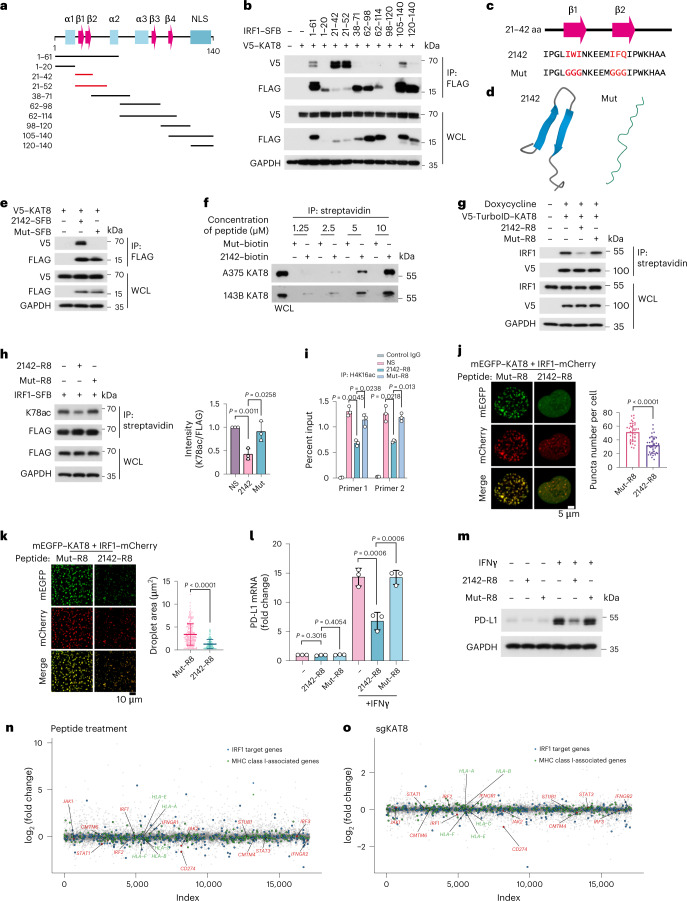
Fig. 7. Disrupting KAT8–IRF1 condensates inhibits PD-L1 expression.
a, Diagram featuring major domains in the IRF1 N terminus (amino acids 1–140) and the truncated constructs that were analyzed in b; α, α helix; β, β-sheet. b, Interactions between V5–KAT8 and the indicated constructs in HEK293T cells. c, The sequence of amino acids 21–42 of IRF1 (2142) and Mut. The core amino acids of the β-sheet predicted by BETApro are in red; aa, amino acids. d, AlphaFold prediction of the structures of the 2142 and Mut fragments. e, Interactions between V5–KAT8 and 2142–SFB/Mut–SFB constructs in HEK293T cells. f, Biotin-conjugated 2142 and Mut peptides at the indicated concentrations were immunoprecipitated from A375 or 143B cell lysates. g, Proximity labeling assay of V5-TurboID–KAT8 and endogenous IRF1 in cells with the indicated peptide treatments (Methods). h, HEK293T cells transfected with IRF1–SFB were treated with 10 μM peptides, and K78ac levels were analyzed; NS, normal saline. i, ChIP–qPCR analysis of H4K16ac abundance at the PD-L1 promoter in A375 cells treated with peptides for 24 h and 100 U ml–1 IFNγ for 12 h. j, Puncta formed by mEGFP–KAT8 and IRF1–mCherry in 143B cells treated with 10 μM peptide for 12 h; n = 36 cells in three independent experiments. k, Droplets formed by 50 μM recombinant mEGFP–KAT8 and IRF1–mCherry mixture in the presence of 50 μM 2142–R8 or Mut–R8 peptide in 100 mM NaCl and no crowding agent. Quantification of the droplet area in the shown images is plotted on the right; n = 208 droplets for Mut–R8; n = 207 droplets for 2142–R8. l,m, RT–qPCR (l) and western blotting (m) analysis of PD-L1 expression in A375 cells treated with 10 μM of the indicated peptides. n,o, RNA-sequencing analysis of A375 cells with peptide treatment (2142–R8/Mut–R8) or KAT8 depletion (sgKAT8/sgNC). Cells were exposed to 100 U ml–1 IFNγ for 6 h before collection; n = 2 biologically independent replicates for each treatment. The experiments in b, e–h, j, k and m were repeated three times with similar results. Data in h–l are shown as the mean ± s.d.; n = 3 biologically independent experiments. P values were calculated by two-tailed Student’s t-test.

