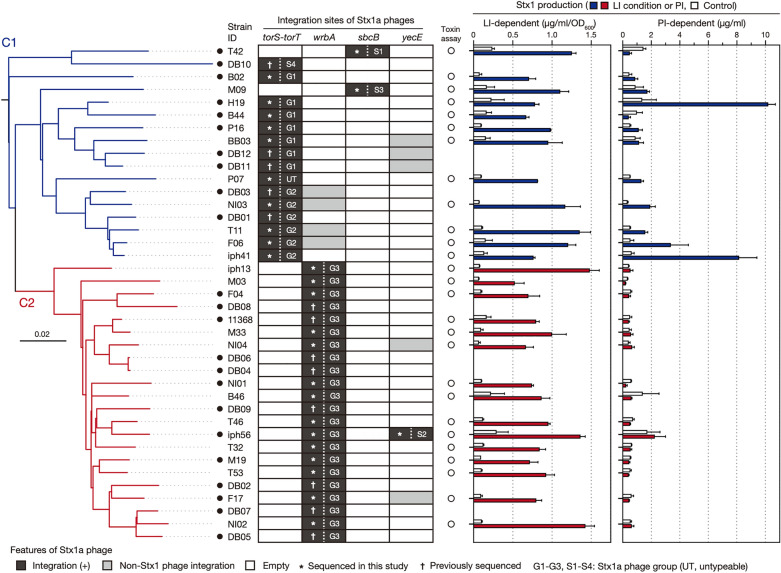
Figure 1.
Variation in the integration site of Stx1a phages and Stx1 production between O26:H11 ST21 strains. A maximum likelihood (ML) tree of 39 O26:H11 ST21 strains is shown in the left panel. The tree was constructed based on the recombination-free SNPs (n = 3575) identified on the conserved chromosome backbone (4,340,670 bp) by RAxML using the GTR gamma substitution model. The route was determined by a similar phylogenetic analysis using an ST29C2 strain (090405) as an outlier. The bar indicates the mean number of nucleotide substitutions per site. Genome-closed strains are indicated by filled circles. Along with the tree, the chromosomal locations and types of Stx1a phages in each strain are shown. In the right panel, the levels of LI- and PI-dependent Stx1 production by each strain are shown as the mean values with standard deviations of biological triplicates or quintuplicates. Stx1 productions in all strains grown in the base medium were also measured as controls. Note that the Stx1 production in 12 strains, whose genome sequences were obtained from NCBI, were not determined.

