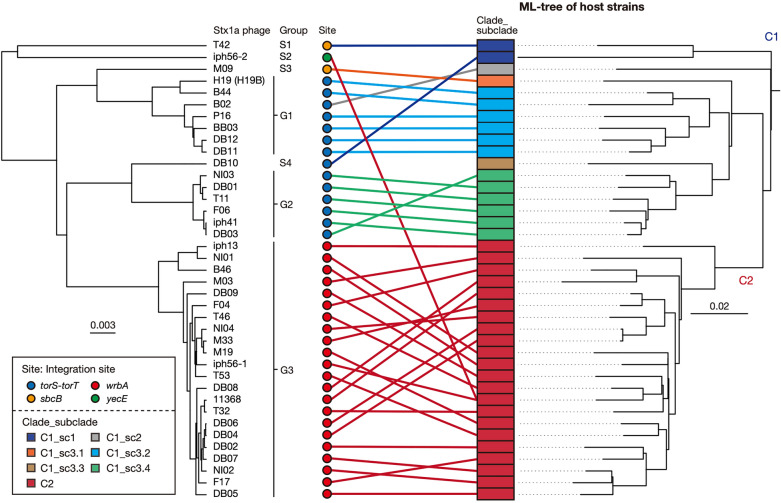
Figure 2.
Sequence similarities between the Stx1a phage genomes found in the 38 O26:H11 strains. A UPGMA dendrogram based on the all-to-all Mash distance matrix of Stx1a phage genomes is shown in the left panel. The bar indicates the rate of sequence mutation estimated under a simple Poisson process of random site mutation (Mash distance)29. The right panel is the same ML tree of O26:H11 strains as shown in Fig. 1. Stx1a phages are connected to their host strains by lines coloured according to the clades of host strains. The degraded Stx1a phage genome in strain P07 (C1_sc3.3) was excluded from the analysis.

