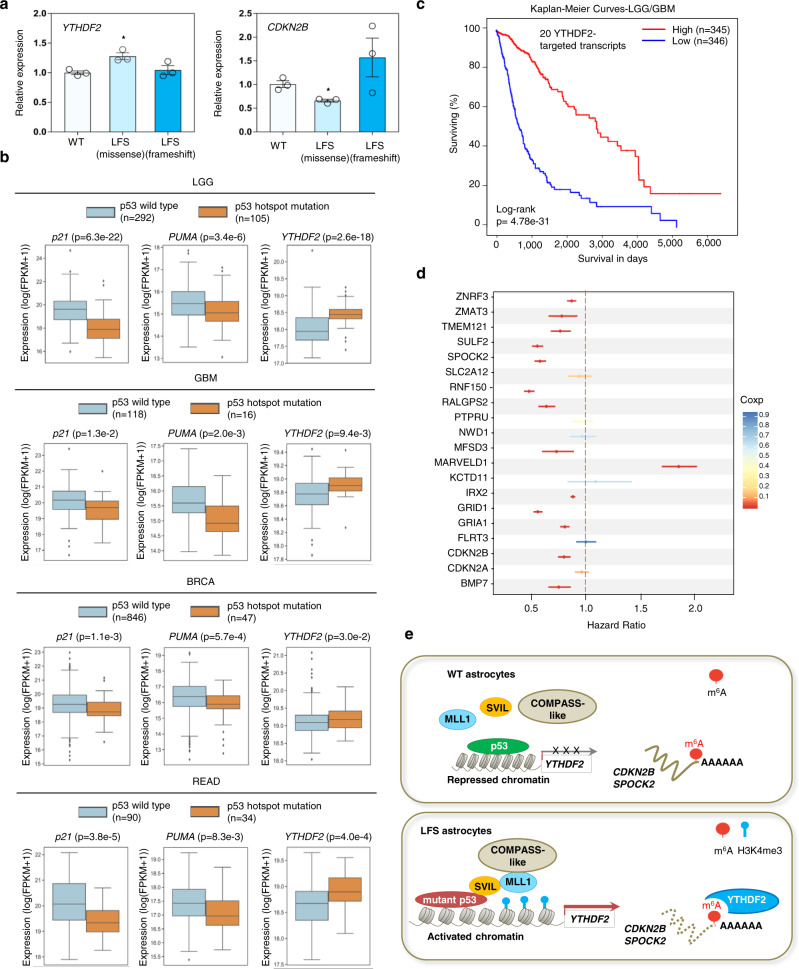
Fig. 7. Clinical relevance of mutant p53 in regulating YTHDF2 expression and the prognostic value of YTHDF2 targets in glioma patients.
a Elevated YTHDF2 expression is observed in LFS stromal cells with a heterozygous M133T mutation but not LFS stromal cells with a heterozygous 12141delG frameshift mutation compared with WT stroma (n = 3 biologically independent samples). The data are presented as the mean ± SEM; unpaired two-tailed Student’s t test. *P < 0.05. b Box plots of TCGA RNA expression profiles (log2) in TCGA tumors with p53 WT or p53 hotspot missense mutations in LGG, GBM, BRCA, and READ specimens. Two-sided Mann Whitney Wilcoxon test is performed to compute significance. Tumors with a p53 hotspot missense mutation demonstrate decreased p21 and PUMA mRNA expression but elevated YTHDF2 mRNA expression. Box edges delineate lower and upper quartiles, the center line represents the median, and whiskers extend to 1.5 times the interquartile range. c Kaplan–Meier curves compare survival in LGG and GBM specimens with high or low levels of YTHDF2-targeted transcripts. Log-rank (Mantel–Cox) test is performed to compute significance. d Estimated hazard ratios and 95% confidence intervals for TCGA LGG and GBM patients expressing high levels of 20 YTHDF2-targeted genes. High expression of 13 of these 20 genes is positively associated with lower hazard ratios and increased survival with FDR q-value less than 5%. e A model linking the mutant p53/SVIL/MLL1 transcriptional regulatory complex to epitranscriptomic changes driving gliomagenesis. In our proposed model, mutant p53 interacts with SVIL, recruits MLL1 to the YTHDF2 promoter, and then induces YTHDF2 transcription. Elevated YTHDF2 downregulates numerous m6A-marked transcripts, including CDKN2B and SPOCK2, promotes neoplastic transformation and initiates gliomagenesis. MLL1 inhibitors selectively suppress YTHDF2 expression, LFS and mutant p53 cell survival, and neoplastic transformation. Source data and exact P values are provided in the Source Data file.

