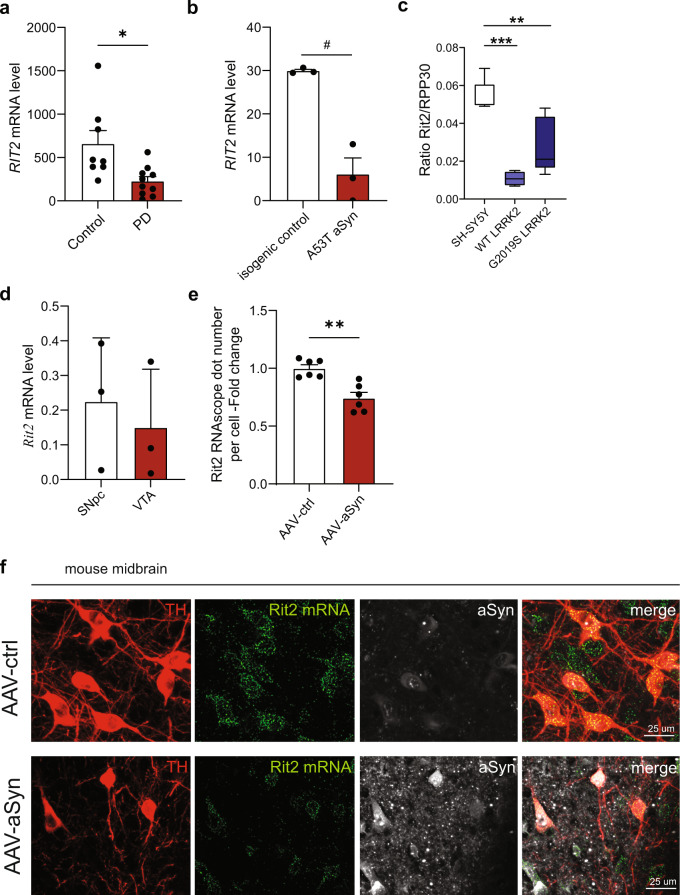
Fig. 1. Rit2 is expressed in human and mouse brain, and is reduced in both sporadic PD patients and in cells overexpressing LRRK2.
a Geo dataset comparing RIT2 expression levels in DA neurons of the SNc isolated by laser capture microdissection. mRNA levels were reduced by 2.2-fold in DA neurons from sporadic PD patients, when compared to healthy controls (GSE20141, controls = 8, PD = 10). b Geo dataset (GSE46798) comparing Rit2 expression in iPSC-derived DA neurons with A53T-aSyn mutation to control mutation-corrected neurons (n = 3). c Droplet Digital PCR was carried out to assess RIT2 mRNA levels in recombinant neuroblastoma cell lines. Ratio of RIT2 mRNA, normalized to RPP30, is reduced in WT and G2019S-LRRK2 cells (n = 3). d Geo dataset (GSE17542) comparing Rit2 expression in SNc and VTA from TH-GFP mice (n = 3). e Quantification of Rit2 mRNA levels in dopaminergic neurons in the midbrain. Viral aSyn expression decreases Rit2 mRNA levels (n = 6). f Fluorescent in situ hybridization (RNAscope®) was employed to show Rit2 mRNA expression in DA neurons of the mouse SNc and TH and aSyn staining were visualized using immunostaining. Data are represented as median, boxes show the IQ and whiskers show min–max or means ± SEM. *p < 0.05, **p < 0.01 two-tailed Student’s t test. #p < 0.05 unpaired t-test with Welch’s correction after D’Agostino-Pearson test for normal distribution. **p < 0.01, ***p < 0.001, one-way ANOVA followed by Bonferroni’s post hoc test.

