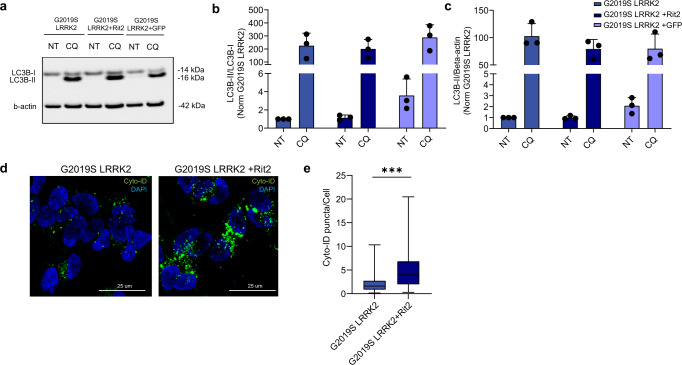
Fig. 2. Overexpression of Rit2 does not affect overall autophagic flux.
a The autophagic flux was assessed in G2019S-LRRK2, G2019S-LRRK2 + Rit2 and G2019S-LRRK2 + GFP cells upon treatment with CQ (100 µM, 3 h) and WB for LC3B. b The ratio between LC3B-II and LC3B-I was not different, suggesting no differences in autophagic flux (n = 3). c Quantification of LC3B levels (normalized to β-actin) indicated no differences upon Rit2 overexpression or CQ-treatment (n = 3). d CytoID assay was employed to visualize autophagosome and autolysosome distribution. e Quantification of CytoID-positive puncta revealed a significant increase in G2019S-LRRK2 cells, when Rit2 was overexpressed (n = 4). Data are represented as median, boxes show the IQ and whiskers show min–max or means ± SEM. In imaging experiments, analysis was conducted on 700–1000 cells per group in each experiment. ***p < 0.01, unpaired two-tailed Student’s t test.

