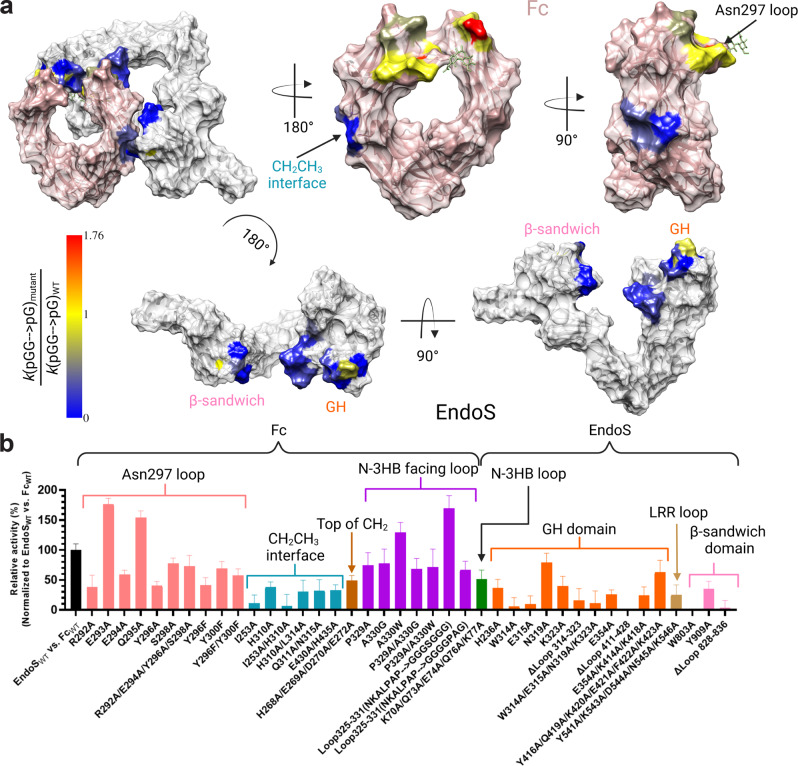
Fig. 3. Alanine scanning mutagenesis of the EndoS-Fc interface.
a Structure of the EndoS (gray) complex with Fc (pink) in which the regions with alanine mutants are color coded based on the relative rates of removal of the N-glycans from Fc alanine mutants by EndoS and vice versa. The rates were measured via LC-MS kinetic analyses. Red indicates the largest increase in hydrolytic activity while blue indicates no hydrolytic activity. b Rates of removal of the first glycan of Fc and Fc alanine mutants by EndoS alanine mutants and EndoS respectively, normalized to EndoS vs. Fc. The kinetic rates were derived using three independent experiments. Data is presented as mean values + /- SD. All rates were statistically significant (multiple comparison test, one-way ANOVA, Tukey method, p < 0.0001 with 95% CI).

