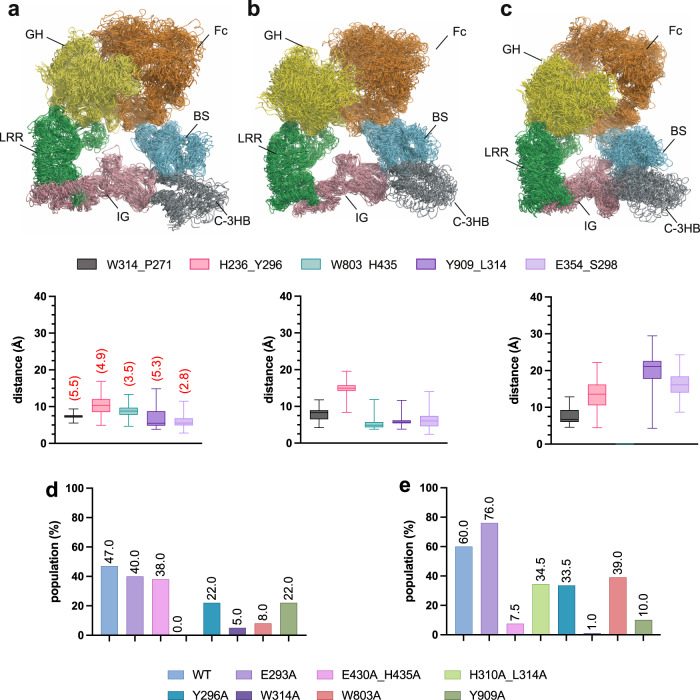
Fig. 4. Molecular dynamics (MD) simulations studies.
Overlay of 25 frames evenly spaced along the 1 µs MD trajectory for (a) EndoS-Fc, (b) EndoS-FcE293A (c) EndoSW803A-Fc, along with the average distance between representative residues. The EndoS protein is shown as blue ribbons and the antibody as gray and orange ribbons. Box-and-whisker plots, showing the minimum, maximum, median, 1st quartile, and 3rd quartile bars, as well as the interquartile range, based on n = 250 evenly distributed values obtained from the MD trajectories. The numbers in red and in parentheses are the experimental values found in the cryo-EM structure. For aromatic residues and Pro, the center of the aromatic ring and the center of the ring are considered, respectively, for these calculations. For L314, S298 and E354 residues, the Cδ, the OH group, and the oxygens of the carboxylate are considered, respectively, for the calculations (cut-off distance: 5.5 Å –π-π stating and CH-π – and 3.5 Å –hydrogen bond–). Errors are given as SD. The numbers in red and in parentheses are the experimental values found in the cryo-EM structure. The dashed lines represent the distance values found in the cryo-EM structure of EndoS-Fc. d Population of the CH-π interaction between Y909 (EndoS) and L314 (Fc) derived from the MD simulations. e Population of salt-bridge K323 (EndoS) and E294 (Fc) derived from the MD simulations. The side chain nitrogen of Lys and the carbon atom of the guanidino group of Arg are considered for these calculations. (cut-off distance: 4.5 Å).

