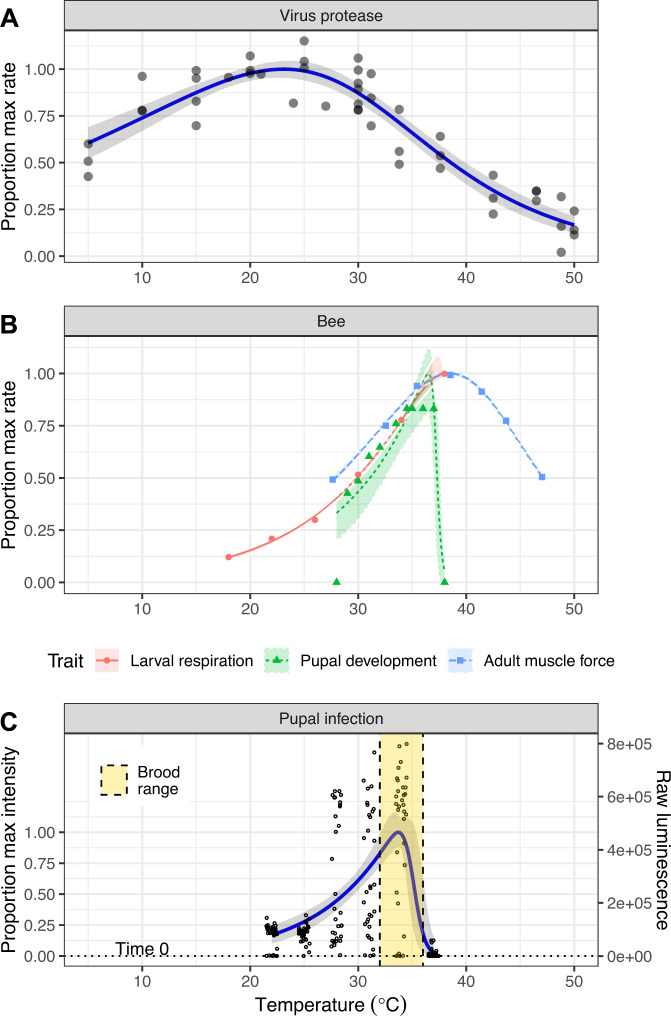
Fig. 1. Effects of temperature on Deformed wing virus, honey bees, and infection.
Panels show data (points) and model predictions (lines), and 95% bootstrap confidence intervals (shaded bands) for virus protease activity (A, upper panel), three bee traits (B, middle panel), and pupal infection (C, lower panel). Data for larval respiration (red circles and solid line), pupal development (green triangles and dotted line), adult muscle force production (blue squares and dashed line), and brood temperature range (yellow vertical region in infection panel) taken from previous observations20,24,26,45. In the lower panel, the secondary y-axis indicates the raw sample luminescence (i.e., before transformation to proportion of maximum intensity) and the horizontal line dotted line represents the mean luminescence of n = 16 samples frozen immediately post-injection. To provide a comparable scale for the different measurements, raw values for all traits are shown as proportions of the trait’s peak model-predicted value.

