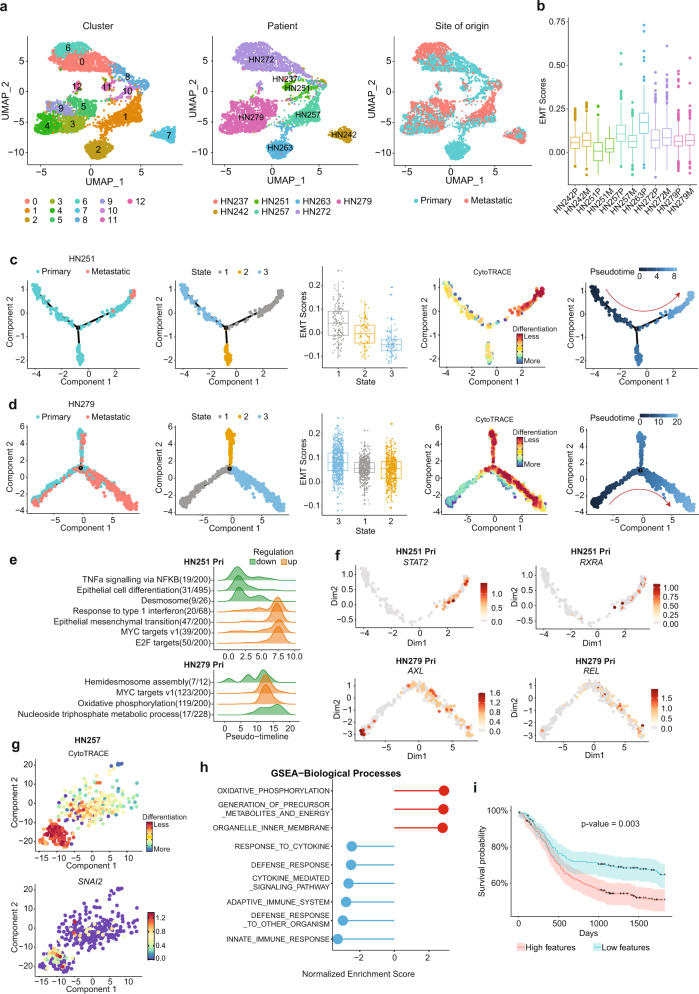
Fig. 2. scRNAseq analysis of malignant epithelial cells and identification of pre-metastatic sub-population.
a UMAP of 6115 malignant epithelial cells only, clustered by Seurat clusters (left), patients (middle), and tissue origin (primary/metastatic) (right). b Turkey boxplot showing epithelial–mesenchymal transition (EMT) scores across patients and tissue origin (primary versus metastasis). N = 6115 cells. c, d Monocle plots demonstrating the derivation of pre-metastatic populations in HN251 (n = 304 cells) and HN279 (n = 1764 cells), (c, d) respectively, based on (from left to right) tissue origin, monocle clusters, EMT scores, CytoTRACE scores to derive trajectory. e Gene ontology pathways that are significantly altered across pseudotime derived in (c, d). f Potentially actionable genes identified to be increased in pre-metastatic population in primary tumors cells of HN251 (upper, n = 228 cells) and HN279 (lower, n = 659 cells). g t-SNE plot of tumor cells in HN257 showing a highly aggressive sub-population in the primary tumor with high CytoTRACE scores and expression of SNAI2. N = 403 cells. h Geneset enrichment analysis (GSEA) showing normalized enrichment scores, and (i) Kaplan-Meier plot of TCGA data showing survival probability (%) over days in patients with high (red) versus low (blue) scores or features based on genes expressed by the specific subpopulation in (g). Shaded area shows 95% confidence interval of the centered median survival time and p value as indicated based on log-rank test. Boxplots in (b, c, d) centered at the median with hinges at 1st and 3rd quartiles and whiskers drawn from hinges to the lowest and highest points within 1.5 interquartile range.

