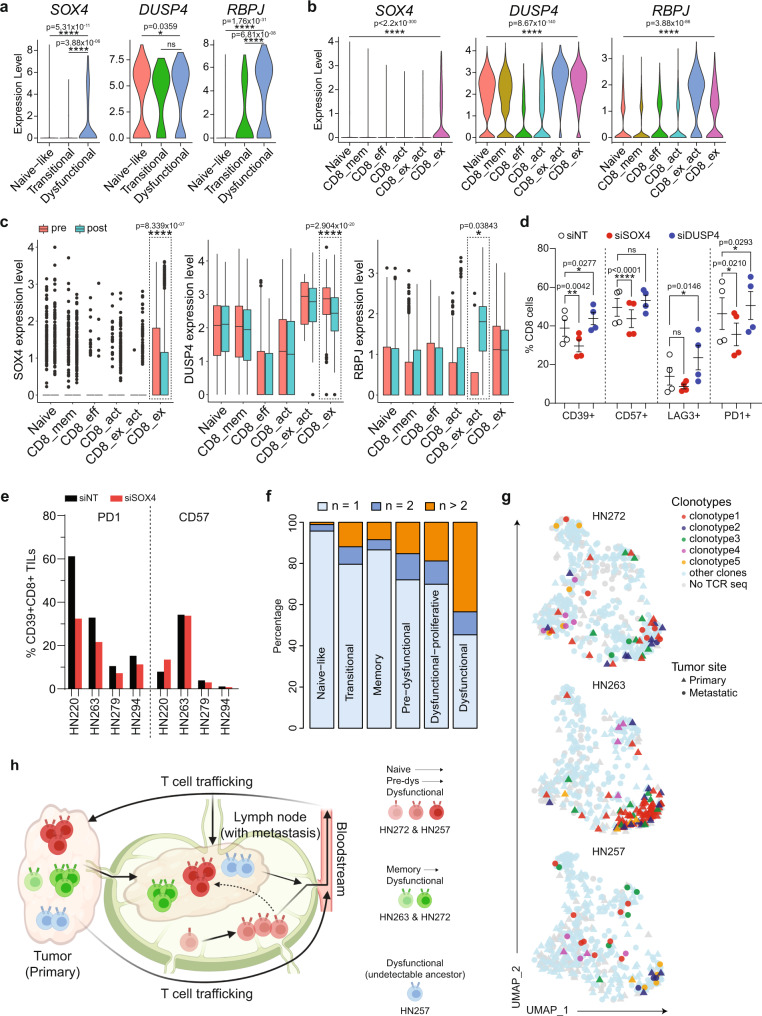
Fig. 5. Functional analysis of genes involved in CD8 dysfunction and T-cell receptor sequencing analysis.
Violin plots showing expression of SOX4, DUSP4 and RBPJ in CD8 T-cell subpopulations derived from published cohorts of scRNAseq meta-dataset from (a) HNSCC (n = 542 cells from 11 patients) and (b) skin squamous-cell cancer (n = 17,561 cells from 11 patients)12, 30. P values are calculated by one-sided unpaired Wilcoxon test. c Boxplots showing expression of SOX4, DUSP4 and RBPJ in CD8 T-cell subpopulations from (b), grouped by pre- (n = 6986 cells) and post-pembrolizumab (n = 10,575 cells) treatment. Boxplot represents median ± upper/lower quartile; whiskers represent 1.5 interquartile range; p values are calculated by two-sided unpaired Wilcoxon test, where *p ≤ 0.05; ****p ≤ 0.0001, ns not significant. Boxplots indicate quartiles with median at middle, and the whiskers drawn at the lowest and highest points within 1.5 interquartile range of the lower and upper quartiles, respectively. b, c X-axis labels: CD8_mem = CD8 memory; CD8_eff = CD8 effector; CD8_act = CD8 activated; CD8_ex_act = CD8 exhausted/activated; CD8_ex = CD8 exhausted. d Bar graph showing percentage of CD8 T cells expressing CD39, CD57, LAG3 or PD1 from PBMCs that were activated and cultured with siNT, siSOX4 or siDUSP4 for 5 days (n = 4). Black lines and error bars represent mean ± SEM. *p ≤ 0.05; **p ≤ 0.01; ****p ≤ 0.0001 indicate significant difference by paired two-tailed t-test compared with siNT of respective markers, ns not significant. e Frequency of CD39+CD8+ TILs expressing PD1 or CD57 that were activated and cultured with siNT or siSOX4 for 5 days (n = 4). d, e Source data are provided as a Source Data file. f Barplots of the percentage of TCR clone(s) detected once (n = 1399 cells), twice (n = 182 cells) or more than two times (n = 405 cells) across the CD8 T-cell subpopulations of all patients with HNSCC subjected to scRNAseq. g UMAP projection of CD8 T cells from HN272 (n = 377 cells), HN263 (n = 340 cells) and HN257 (n = 347 cells) colored by selected TCR clonotypes. h Schematic diagram summarizing the development and trafficking of CD8 T-cell clones between primary tumor, lymph-node and metastasis, and bloodstream of HN272, HN263 and HN257 based on the clonotype data from (f). Diagram was created with BioRender.com.

