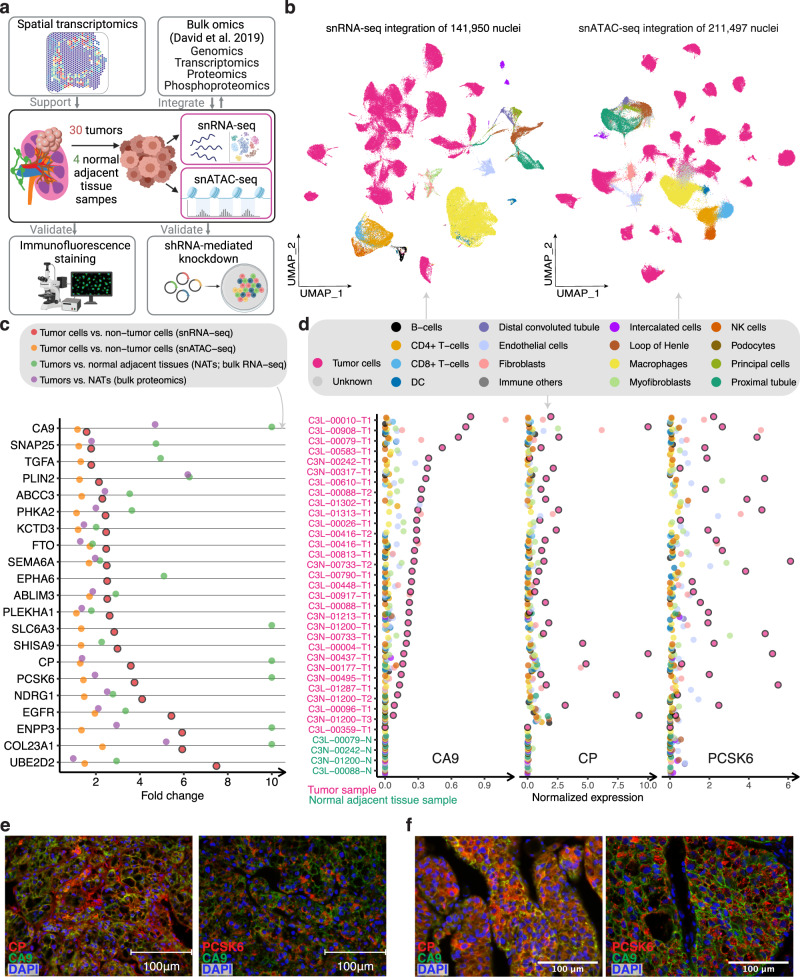
Fig. 1. snRNA-seq analysis identifies tumor-cell-specific markers.
a Schematic for integrating snRNA-seq, snATAC-seq, bulk omics, and spatial transcriptomics data, and validating the omics findings with immunofluorescence staining and shRNA-mediated knockdown experiments (image is created with BioRender.com. b UMAP visualization of 141,950 nuclei and 211,497 nuclei profiled by snRNA-seq and snATAC-seq, respectively, colored by major cell groups. The cell group named “immune others” includes basophils, mast cells, lymphoid lineage immune cells with proliferating signature, and immune cells with ambiguous myeloid/lymphoid identity. c Dot plot showing the fold changes of expression of tumor-cell markers in ccRCC (capped at 10). Red dots denote the gene expression fold changes between tumor cells vs. non-tumor cells using snRNA-seq data. Orange dots denote the gene accessibility fold changes between tumor cells vs. non-tumor cells using snATAC-seq data. Green dots denote the gene expression fold changes between bulk tumor and normal adjacent tissue (NAT) samples using bulk RNA-seq data. Purple dots denote the bulk protein level changes (spectrum intensity) between tumors vs. NAT samples. d Dot plot showing the expression levels of CA9, CP, and PCSK6 in each cell type and each sample (non-log space). Expression levels for tumor cells are highlighted by black outlined circles. Immunofluorescence (IF) staining of a ccRCC e patient tumor sample (ID: 293) and f patient-derived xenograft tumor (ID: RESL5). Left panel, markers CP (red), CA9 (green), and DAPI (nucleus, blue). Right panel, markers PCSK6 (red), CA9 (green), and DAPI (nucleus, blue). Scale bars in the (e, f) are 100 μm. Three independent experiments were performed with similar results. Scale Source data are provided as a Source data file.

