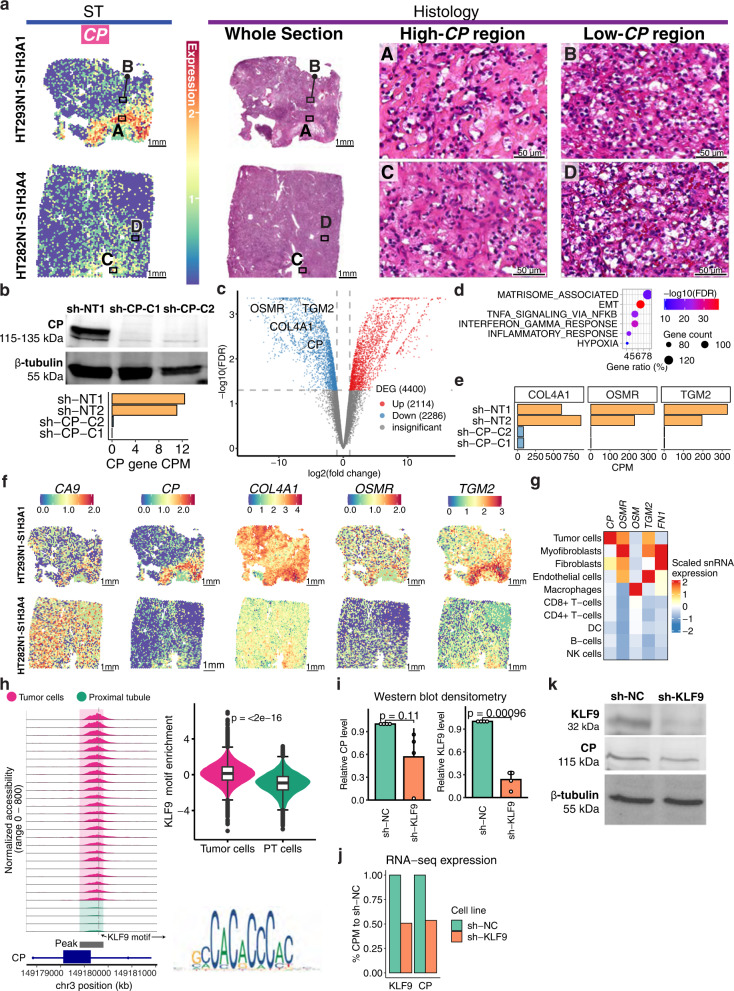
Fig. 2. Ceruloplasmin (CP) spatial expression pattern and CP knockdown effect on the transcriptome in ccRCC cells.
a Spatial transcriptomics and H&E histology of two ccRCC specimens. Regions showing high-CP (regions A and C) and low-CP (regions B and D) expression were indicated. Scale bars are 1 mm. b Top: Western blot of CP and β-tubulin on proteins from Caki-1 cells expressing CP shRNA (sh-CP-C1, sh-CP-C2) and non-transduced Caki-1 cells (sh-NT1). Three independent experiments were performed that showed similar results. Bottom: Bar plot showing normalized bulk gene expression of CP. c Volcano plot showing differentially expressed genes between Caki-1 cells with CP knockdown (sh-CP-C1 and sh-CP-C2) vs. cells without CP knockdown (sh-NT1 and sh-NT2). Statistical evaluation was performed using two-sided edgeR analysis with glmQLFTest followed by multiple testing correction (Benjamini–Hochberg). d Bubble plot showing the pathways over-represented in genes downregulated (top) in the CP-knockdown lines (sh-CP-C1 and sh-CP-C2) vs. controls (sh-NT1 and sh-NT2). The p.adjust represents Benjamini–Hochberg adjusted P-value from one-sided Fisher’s exact test. e Bar plot showing normalized bulk gene expression of COL4A1, OSMR, and TGM2 in sh-CP-C1, sh-CP-C2, sh-NT1, and sh-NT2. f Spatial transcriptomics for CA9, CP, COL4A1, OSMR, and TGM2. g Heatmap showing scaled snRNA-seq expression of CP, OSMR, OSM, TGM2, and FN1 across cell types. h Left: Genomic region near CP gene promoter (in ccRCC cells). The plots show the normalized accessibility by snATAC-seq around these regions in proximal tubule cells (green; n = 123,35) from NAT samples and tumor cells (pink; n = 119,191) from tumor samples. Top right: Violin plot showing the distribution of KLF9 motif enrichment scores in tumor cells (n = 119,191) and PT cells (n = 123,35). The box bounds the interquartile range divided by the median, with the whiskers extending to a maximum of 1.5 times the interquartile range beyond the box. Outliers are shown as dots. Student’s T-test; P value is two-sided. Bottom right: position weight matrix for KLF9 motif. i Bar plot showing western blot densitometry of KLF9 and CP proteins in RCC4 cells expressing KLF9 shRNA (sh-KLF9) and RCC4 cells expressing scrambled control (sh-NC). The error bar represents the standard deviation of the mean from four independent experiments performed. Wilcoxon rank-sum tests; P values are two-sided. j Bar plot showing % of normalized gene expression of KLF9 and CP compared to the control. k Western blot showing KLF9, CP, and β-tubulin protein levels in sh-NC and sh-KLF9. Four independent experiments were repeated and showed similar results (as shown in i). Source data are provided as a Source data file.

