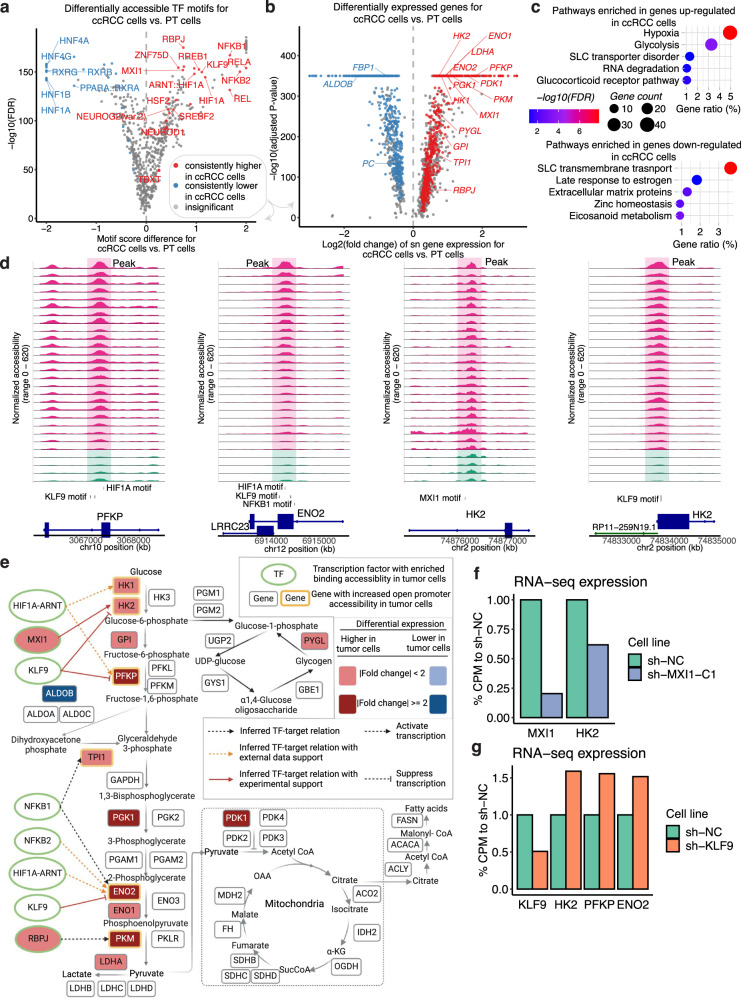
Fig. 3. The glycolysis pathway displays significant changes in ccRCC tumor cells compared to the proximal tubule cells.
a Volcano plot showing differentially enriched TF motifs between ccRCC (tumor) cells (n = 118,409) from 30 tumor samples and the combined proximal tubule (PT) cells from the four NATs (n = 9676). The X-axis shows the motif score difference, while the Y-axis shows the −log10(adjusted P-value). Statistical evaluation was performed using a two-sided Wilcoxon rank-sum test, applying Benjamini–Hochberg correction for the resulting P-values. Color denotes whether a motif is consistently higher or lower in tumor cells when tumor cells from individual tumor samples were compared to the PT cells or if it has insignificant or inconsistent fold changes (“Methods”). The motifs that have consistent higher/lower TF binding accessibilities in all comparisons of individual tumor vs. PT cells are highlighted. b Volcano plot showing differentially expressed genes between ccRCC cells (n = 88,536) and the combined PT cells from the NATs (n = 4269). The X-axis shows the log2(fold change) of the sn gene expression of the ccRCC cells compared to PT cells; the Y-axis shows the −log10(adjusted P-value). Statistical evaluation was performed using a two-sided Wilcoxon rank-sum test, applying Bonferroni correction for the resulting P-values. Color denotes whether a gene is consistently expressed higher or lower in tumor cells, or has insignificant or inconsistent fold changes (“Methods”). Genes for ccRCC-specific TFs and selected metabolic genes with significant fold changes are highlighted. c Bubble plot showing the pathways over-represented in genes upregulated (top) and downregulated (bottom) in ccRCC cells compared to the PT cells. The FDR represents Benjamini–Hochberg adjusted P-value from one-sided Fisher’s exact test. d Genomic regions near three upregulated genes in ccRCC cells compared to PT cells. The plots show the normalized accessibility by snATAC-seq around these regions in proximal tubule cells (green) from NAT samples and ccRCC cells (pink) from tumor samples. e When viewed in the context of important metabolic pathways in ccRCC, ccRCC cells displayed an overall upregulation of genes encoding glycolysis enzymes as well as other metabolic proteins (rounded rectangle) at sn gene expression level (red and blue filled colors represent significantly increased or decreased sn expression in ccRCC cells vs. proximal tubule cells). Among them, genes showing increased promoter accessibility are highlighted by the yellow border. Ellipses with green borders represent transcription factors with significantly enriched accessibility binding in ccRCC cells vs. PT cells. Lines connecting TFs and genes represent TF-target relations inferred by the presence of the TF motif in the more accessible promoter region of the genes using snATAC-seq. Black dotted lines denote inferred TF-target relation based on the snATAC-seq data in this study. Orange dotted lines denote those relations with literature support. Red solid lines denote those relations with experimental validation done in this study. Created with BioRender.com. f Bar plot showing the bulk RNA-seq expression of RCC4 cells with and without MXI1 knockdown. g Bar plot showing the bulk RNA-seq expression of RCC4 cells with or without KLF9 knockdown. Source data are provided as a Source data file.

