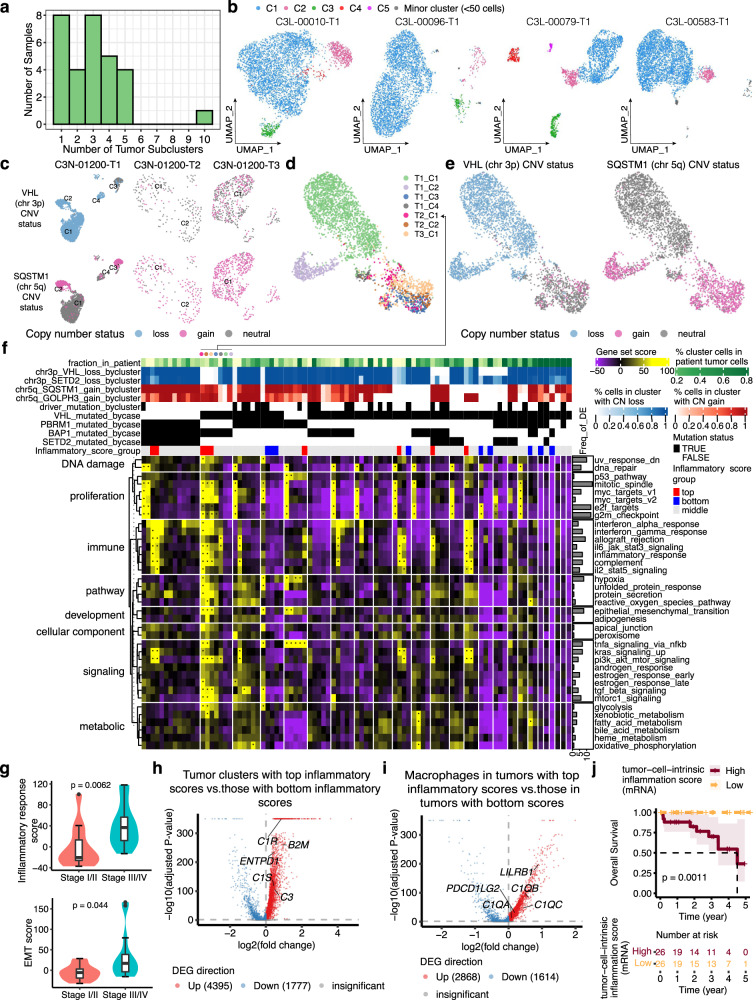
Fig. 4. Intratumor signaling heterogeneity revealed by single-cell tumor subclustering.
a Bar plot showing the number of tumor-cell clusters per sample. b UMAP illustration of the tumor-cell clusters for four tumor samples, colored by the cluster name. c UMAP showing tumor clusters of three tumor samples from the same patient, colored by the copy number status of VHL and SQSTM1. d UMAP showing merged data for tumor cells from the above three tumor samples, colored by the original tumor cluster name. e UMAP showing the copy number status of VHL and SQSTM for the merged data shown in (d). f Heatmap showing the gene set scores for 90 tumor subclusters (columns). Tumor subclusters are grouped by patient and separated by white lines. g Violin plot showing maximum inflammatory response score (top) and EMT score (bottom) per tumor sample, grouped by tumor stage (stage I/II: n = 12; stage III/IV: n = 22). The box bounds the interquartile range divided by the median, with the whiskers extending to a maximum of 1.5 times the interquartile range beyond the box. Outliers are shown as dots. Wilcoxon rank-sum tests; P values are two-sided. h Volcano plot showing differentially expressed genes between tumor clusters with top 10% quantile inflammatory scores vs. those with the bottom 10% quantile inflammatory scores (annotated in f). i Volcano plot showing differentially expressed genes between macrophages in tumors with top 10% quantile inflammatory tumor-cluster scores vs. macrophages in tumors with the bottom 10% quantile inflammatory tumor-cluster scores (annotated in f). j Kaplan–Meier survival analysis showing overall survival after initial pathological diagnosis. Statistical evaluation was performed using a two-sided log-rank test. Patients with high tumor-cell-intrinsic inflammation score (n = 26, top 25% percentile) displayed significantly lower chance of survival compared to patients with low inflammation score (n = 26, bottom 25% percentile) using bulk RNA-seq data. In h and i, statistical evaluation was performed using a two-sided Wilcoxon rank-sum test, applying Bonferroni correction for the resulting P-values. Source data are provided as a Source data file.

