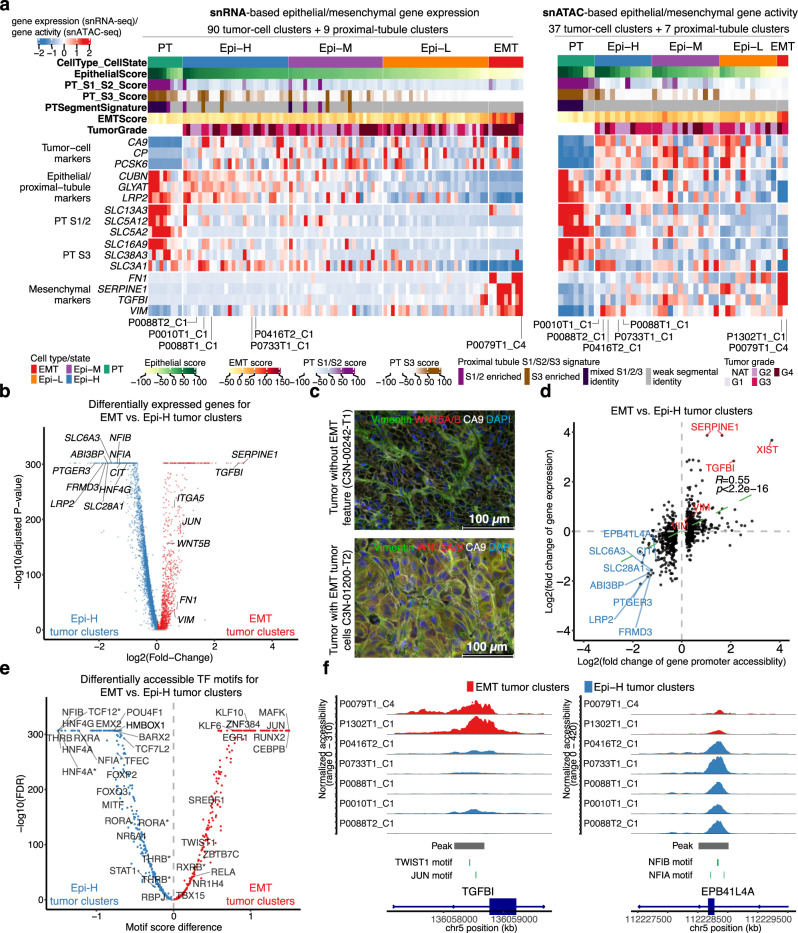
Fig. 5. Four tumor subgroups with distinct epithelial and mesenchymal features.
a Left: Heatmap showing gene expression of the epithelial and mesenchymal marker genes for tumor clusters and proximal tubule (PT) clusters (>50 cells) using snRNA-seq data. Right: Heatmap showing gene activity of the epithelial and mesenchymal marker genes for tumor clusters and PT clusters (>50 cells) using snATAC-seq data. b Volcano plot showing differentially expressed genes between the EMT tumor clusters and Epi-H tumor clusters highlighted in (a). Labels on the right denote known mesenchymal markers, while those on the left denote known markers for PT cells. Statistical evaluation was performed using a two-sided Wilcoxon rank-sum test, applying Bonferroni correction for the resulting P-values. c Immunofluorescence staining of vimentin (VIM), CA9, WNT5A/B, and DAPI, showing VIM and WNT5A/B in CA9 + cells in the cross-sections of the tumor with EMT tumor cells (C3N-01200-T2), but not in the control tumor (C3N-00242-T1). Two independent experiments were performed with similar results. Scale bar, 100 μm. d Scatter plot displaying the log2 transformed fold change for gene promoter accessibility versus log2 transformed fold change for gene expression in EMT tumor clusters vs. Epi-H tumor clusters (shown in b). The P-value is derived from a two-sided Spearman rank correlation test (P-value = 9.2e−72). e Volcano plot showing differentially accessible TF motifs between the EMT tumor clusters and Epi-H tumor clusters. Asterisks denote the var.2 version of the TF motif based on the JASPAR database. Statistical evaluation was performed using a two-sided Wilcoxon rank-sum test, applying Benjamini–Hochberg correction for the resulting P-values. f Genomic regions near TGFBI (upregulated in EMT tumor clusters) and EPB41L4A (upregulated in Epi-H tumor clusters). The plots show the normalized accessibility by snATAC-seq around these regions in EMT tumor clusters (red) and Epi-H tumor clusters (blue). Source data are provided as a Source data file.

