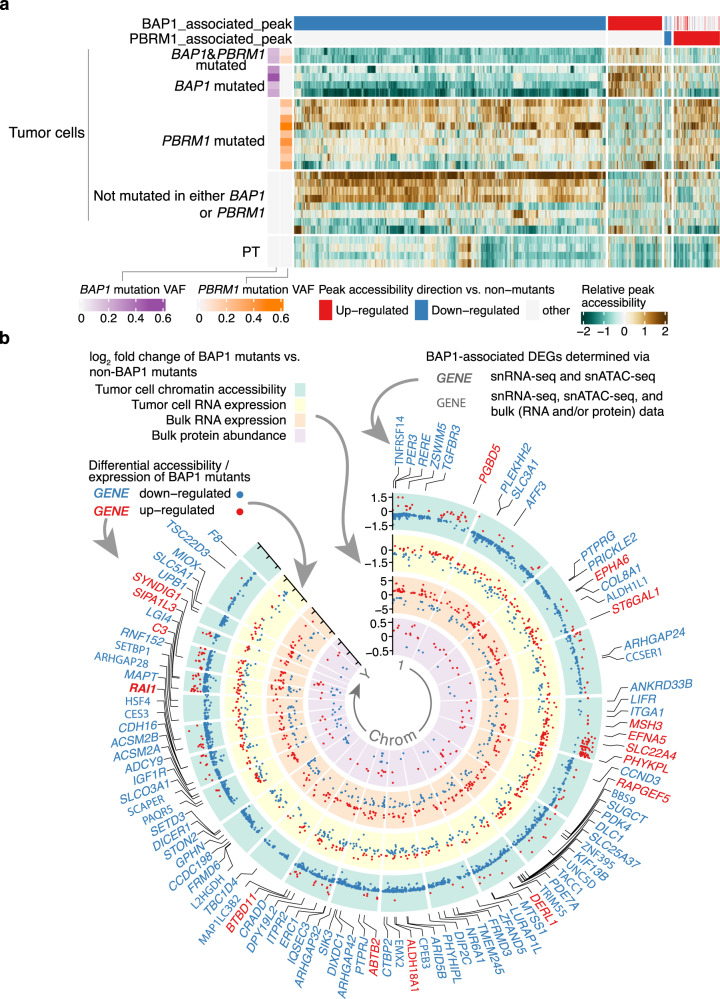
Fig. 6. Chromatin accessibility landscape of BAP1 and PBRM1 mutant tumors.
a Heatmap showing the relative changes in ATAC-peak accessibility for peaks differentially accessible between the tumor cells of BAP1-mutated tumors (6 tumors, including 2 BAP1- and PBRM1-mutated tumors, 29,366 cells) vs. non-BAP1/PBRM1-mutated tumors (8 tumors; non-mutants) and peaks differentially accessible between tumor cells of PBRM1-mutated tumors (9 tumors, 32,255 cells) vs. non-BAP1/PBRM1-mutated tumors (non-mutants). Each column is an ATAC peak, and only significantly and consistently changed peaks are plotted (FDR < 0.05, “Methods”). Only samples with >8% mutation VAF in BAP1 or PBRM1 are shown (1 sample excluded). b Circos plot showing the genome-wide chromatin accessibility, gene expression, and protein abundance changes associated with BAP1 mutation. The green circle contains significantly different ATAC peaks in BAP1-mutated vs. non-BAP1-mutated tumors, with each dot representing one ATAC peak. The labeled y-axis represents the fold changes of the peak accessibility change. Red and blue dots denote peaks with higher and lower accessibility peaks in BAP1-mutated vs. non-BAP1-mutated tumors, respectively. The yellow circle plots the fold changes of the differentially expressed genes (DEGs) associated with BAP1 mutation discovered by snRNA-seq data (FDR < 0.05), with each dot representing one gene. The orange circle displays the fold changes of the DEGs associated with BAP1 mutation (FDR < 1e−04, |log2FC| > 1) discovered by the CPTAC bulk RNA-seq data (n = 103). The innermost purple circle plots the fold changes of differentially expressed proteins associated with BAP1 mutation (FDR < 0.05) discovered by the CPTAC bulk proteomics data (n = 103). Similarly, the red and blue colors for the dots denote higher and lower expression for the genes/proteins in BAP1-mutated vs. non-BAP1-mutated tumors. The gene symbols highlighted outside the circles represent genes showing the consistent direction of snRNA-seq and snATAC-seq changes in BAP1 mutants vs. non-mutants (absolute log2 fold change >= 0.3). Red gene symbols represent genes with increased promoter/enhancer accessibility and gene expression in BAP1 mutants. Blue gene symbols represent genes with decreased promoter/enhancer accessibility and gene expression in BAP1 mutants. Gene symbols in bold font represent the genes mentioned above with consistent expression change in either bulk RNA-seq or bulk protein data. Source data are provided as a Source data file.

