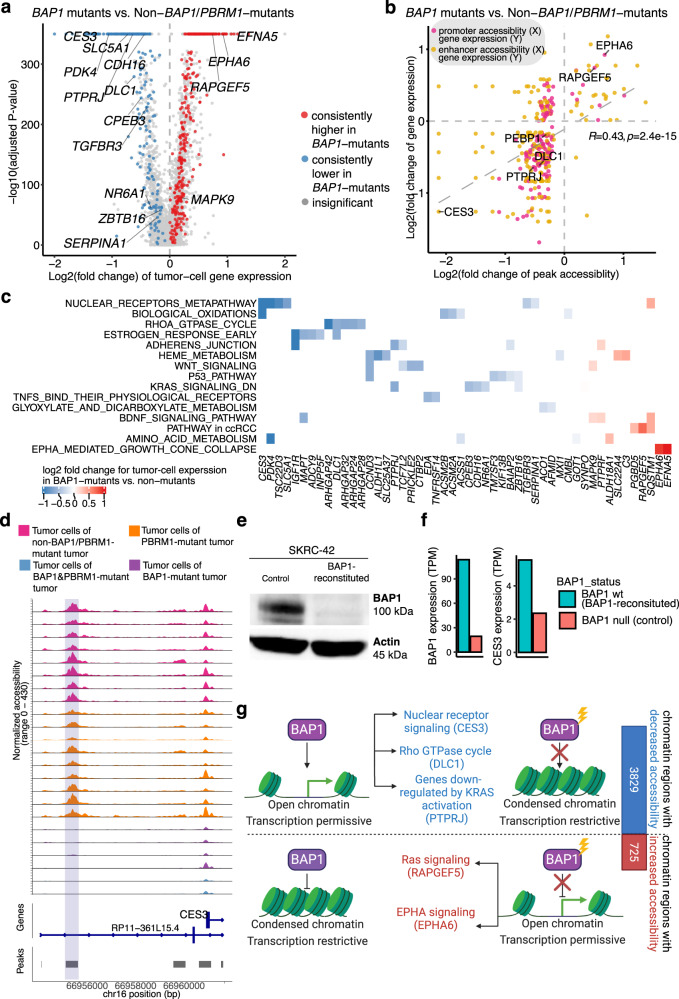
Fig. 7. Impact of BAP1 mutations on chromatin accessibility and transcriptional networks.
a Volcano plot displaying the differentially expressed genes (DEGs) between the tumor cells of BAP1-mutated tumors (26,806 cells) vs. tumor cells of non-BAP1/PBRM1-mutated tumors (31,002 cells) by snRNA-seq data. Statistical evaluation was performed using a two-sided Wilcoxon rank-sum test, applying Bonferroni correction for the resulting P-values. Dots are colored by whether the genes showed significant and consistent fold changes in individual comparisons of each BAP1-mutated tumor vs. non-BAP1/PBRM1-mutated tumors. b Scatter plot showing the positive correlation of chromatin accessibility and transcriptional changes. The log2(fold change) of the snRNA-seq expression for each gene (mRNA) is plotted against the log2(fold change) in the relative snATAC-seq peaks (for all the genes or promoter/enhancer peaks with significant fold change in over 50% of the comparisons for individual BAP1-mutated tumor vs. non-BAP1/PBRM1-mutated tumors). The P-value is derived from a two-sided Spearman rank correlation test (P-value = 2.4e−15). Each dot represents a gene-peak pair. Dots are colored by whether the peak overlaps the gene promoter or is a potential enhancer (co-accessible with the promoter peak). c Heatmap showing the pathways associated with the BAP1-associated DEGs with promoter/enhancer accessibility change (represented in b). d Genomic regions near the CES3 gene in BAP1-mutated tumors vs. non-BAP1-mutated tumors. The plots show the normalized accessibility signal by snATAC-seq around these regions in tumor cells of BAP1-mutant tumors (purple), tumor cells of PBRM1-mutant tumors (orange), tumor cells of non-BAP1/PBRM1-mutant tumors (pink). e Western blot showing BAP1 and Actin protein levels in the BAP1-reconstituted and control SKRC-42 cells. Three independent experiments were performed that showed similar results. f Bar plot showing BAP1 and CES3 gene expression in the BAP1-reconstituted and control SKRC-42 cells. g Schematic diagram showing the differential effects of BAP1 mutations on chromatin accessibility. Created with BioRender.com. Source data are provided as a Source data file.

