Fig. 1.
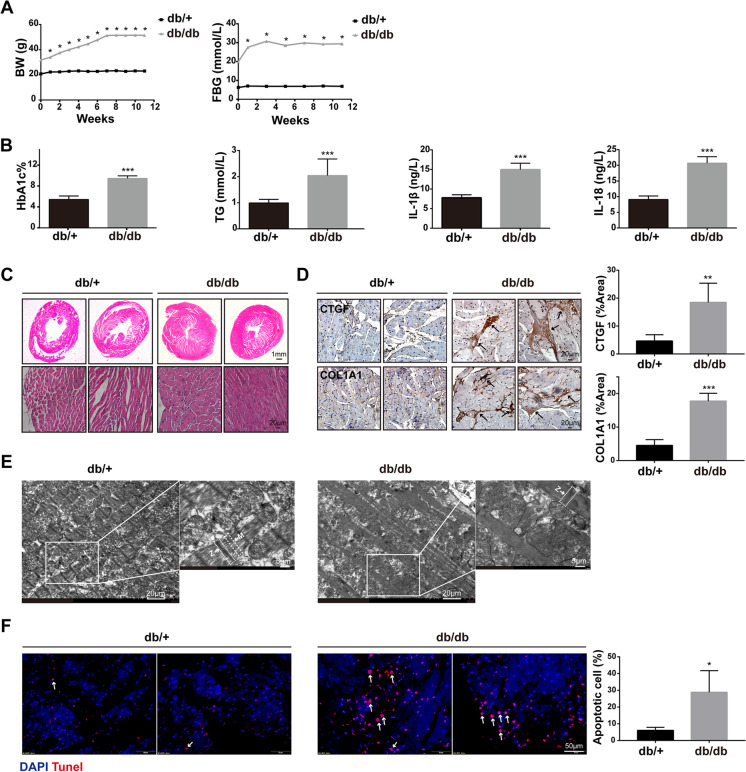
Diabetic cardiomyopathy occurred in HFD-fed db/db mice. A Dynamic changes of body weight (BW) and fasting blood glucose (FBG) in db/ + and db/db mice during ND and HFD feeding, respectively (n = 8, *P < 0.05 vs 0 week, using unpaired two-tailed t test). B The level of HbA1c, TG, IL-1β, and IL-18 in the blood of two groups of mice (n = 4, ***P < 0.001 vs db/ + group, using unpaired two-tailed t test). C Representative images of the morphological analysis by H&E staining of heart tissue. D CTGF and COL1A1 expressions in hearts of HFD-fed db/db mice were visualized by IHC staining (n = 4, **P < 0.01, ***P < 0.001 vs db/ + group, using unpaired two-tailed t test). E Representative transmission electron microscopy images of myofilament arrangement in db/ + mice and db/db mice (n = 4). The arrow indicated Z-line or M-line. F Representative images of cardiomyocyte apoptosis reflected by TUNEL staining, counterstained with DAPI (blue). The arrow indicated apoptotic cell (n = 4, *P < 0.05 vs db/ + group, using unpaired two-tailed t test)

