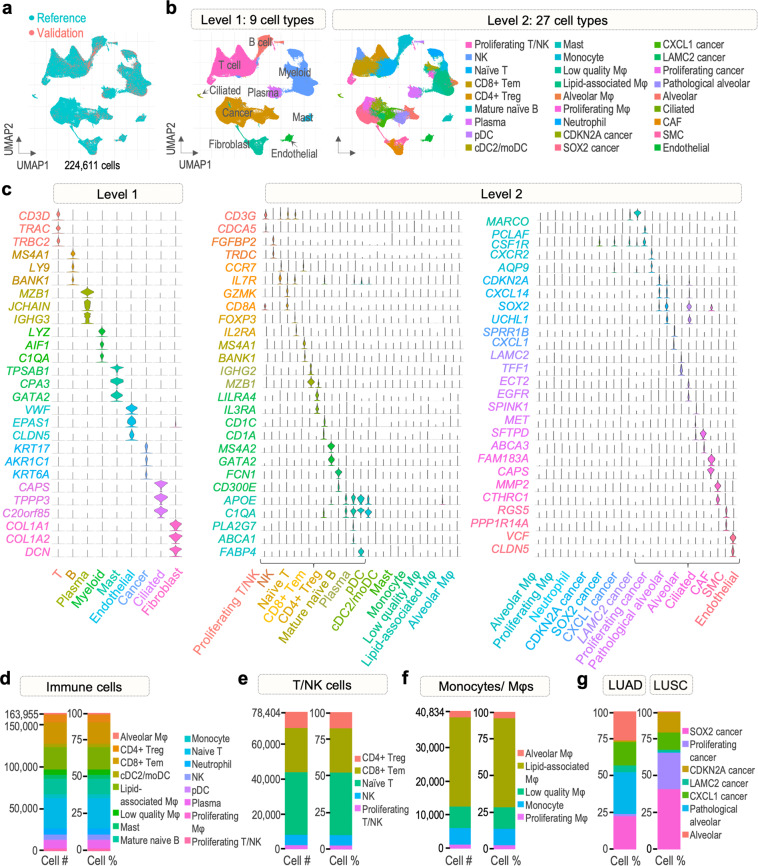
Fig. 4.
Cell types of the final dataset. (a) Distribution of cells derived from the reference and validation datasets in the final dataset. (b) Two levels of cluster annotation. (c) Violin plots of cell type-specific gene markers used for level 1 and 2 annotations. (d) Number of cells from immune cell population and their proportion. (e) Number of cells from population of T and NK cells and their proportion. (f) Number of cells from population of monocytes and macrophages and their proportion. (g) Proportion of cells from cancer cell population in LUAD and LUSC samples.

