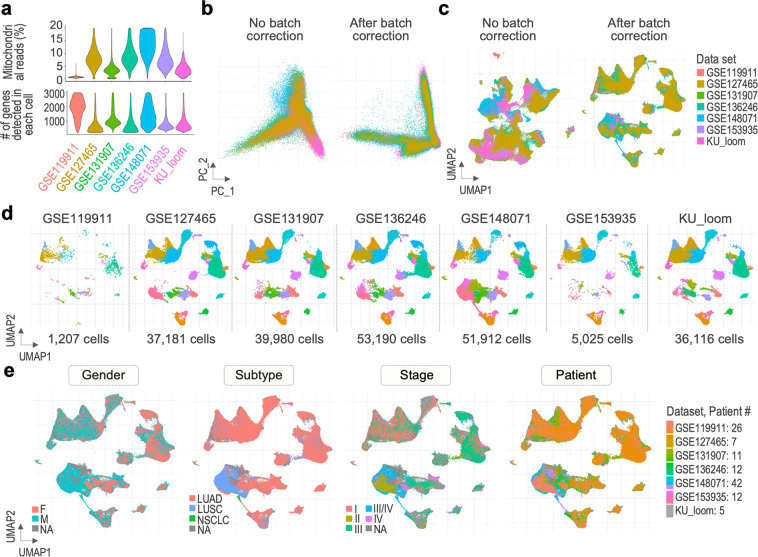
Fig. 5.
Quality of the final dataset. (a) Violin plots showing QC metrics of cells included in the final dataset, including percentage of counts from mitochondrial genes (Percent_mt) and number of genes (nFeature_RNA), split by study. (b) Removal of the batch effect presented by PCA and dimensional reduction plots (c) for the final dataset, in a comparison to a merged dataset without batch correction. (d) Distribution of cells from the seven analyzed datasets in the clusters of the final dataset. (e) UMAP plots of the final dataset cells grouped by clinical metadata, including gender, subtype, stage, and patient.

