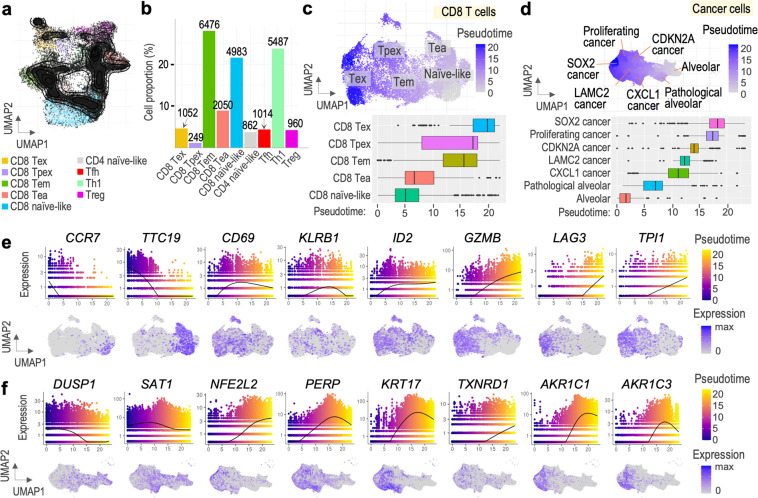
Fig. 6.
Pseudotime trajectory analysis. (a) Distribution of query T cells on ProjecTILs reference map. (b) Percentage and number of T cells from each functional state. (c) UMAP plot of CD8+ T cell subset colored by pseudotime (top) and boxplot showing median pseudotime of each cell type (bottom). (d) UMAP plot of cancer cell subset colored by pseudotime (top) and boxplot showing median pseudotime of each cell type (bottom). (e) Chosen genes of the CD8+ T cell subset showing changing expression in pseudotime. (f) Chosen genes of the cancer cell subset showing changing expression in pseudotime.

