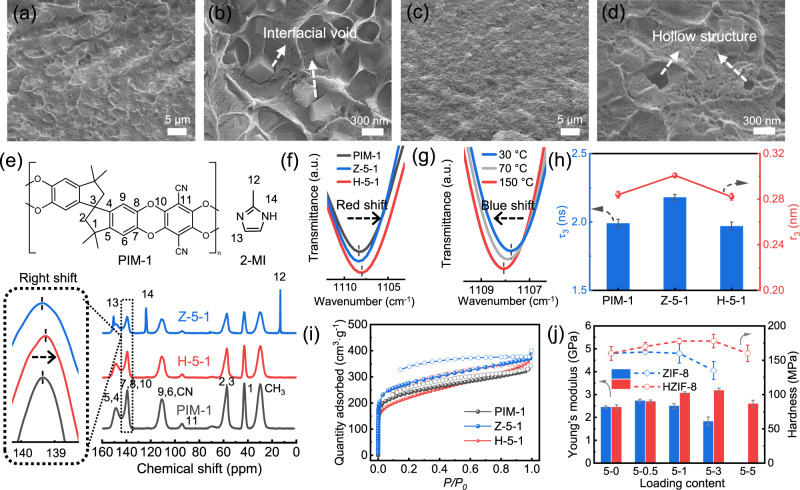
Fig. 2. Membrane characterizations.
a–d SEM images of cross-sections of Z-5-1 (a, b) and H-5-1 (c, d); e Solid 13C nuclear magnetic resonance (NMR) spectroscopy of PIM-1, Z-5-1, and H-5-1; f FT-IR spectra of aromatic ether group in PIM-1, Z-5-1, and H-5-1 membranes; g Temperature dependence of aromatic ether group absorption from 30 °C to 150 °C in H-5-1 membranes; h Positron annihilation lifetime spectroscopy (PALS) data of PIM-1, Z-5-1, and H-5-1 membranes. Error bars correspond to the standard deviations from three independent tests; i N2 isotherm at 77 K of PIM-1, Z-5-1, and H-5-1 membranes; j Young’s modulus and nanoindentation hardness of PIM-1/ZIF-8 and PIM-1/HZIF-8 MMMs at different loadings. Error bars correspond to the standard deviations, as obtained from six points.

