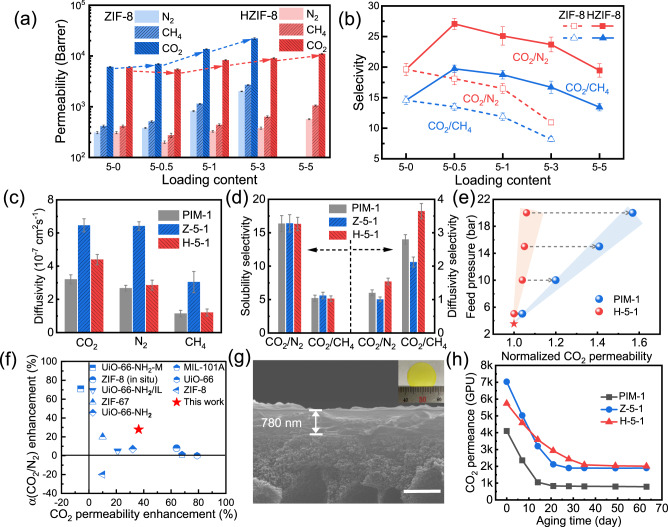
Fig. 3. Gas transport performance.
a, b Gas permeability (a) and ideal selectivity (b) in MMMs as a function of filler content at 35 °C and 3.5 bar. Error bars represent the standard deviations obtained from three membranes; c, d Diffusivity (c) of CO2, N2, and CH4, and sorption and diffusion selectivity (d) of CO2/N2, CO2/CH4 in PIM-1, Z-5-1, and H-5-1. Error bars represent the standard deviations obtained from three membranes; e Normalized CO2 permeability of PIM-1 and H-5-1 membranes with CO2 feed pressure increasing from 3.5 to 20 bar; f Comparison of the CO2 permeability versus CO2/N2 selectivity improvement for PIM-1/MOF MMMs in the literature with the optimal result in this study. The blue dots represent the data from references, as listed in Supplementary Table 7, and the red star represents the H-5-1 membrane. Source data are provided as a Source Data file; g Cross-sectional SEM image of the H-5-1 thin-film membrane on the surface of PI support. The inserted picture is the corresponding macro digital photo (Scale bar: 1 μm); h Ageing behavior of PIM-1, Z-5-1, and H-5-1 thin-film membranes. The samples are directly exposed to the atmosphere during the test interval.

