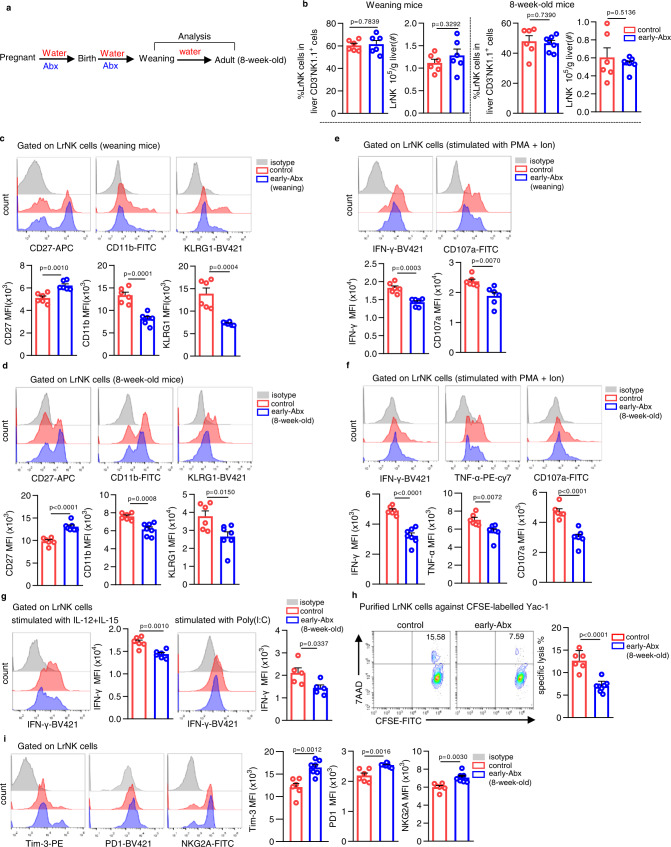
Fig. 1. Early-life gut microbiota sustains the maturation and function of LrNK cells.
a Schemes of early-Abx mouse model experimental design. b Representative FACS plots and bar graphs for the percentages and absolute number of LrNK cells from control and early-Abx mice (weaning mice: n = 6 per group; 8-week-old mice: control n = 6, early-Abx n = 7). c, d Representative FACS plots and bar graph for the expression level (MFI) of CD11b, CD27 and KLRG1 in LrNK cell subsets from weaning or adult control and early-Abx mice (weaning mice: control n = 6, early-Abx n = 6; 8-week-old mice: control n = 6, early-Abx n = 7). e, f Representative FACS plots bar graph and for the expression (MFI) of effector molecules in PMA and Ion-stimulated LrNK cells from weaning or adult control and early-Abx mice (weaning mice: n = 6 per group; 8-week-old mice: control n = 6, early-Abx n = 7). g Representative FACS plots and bar graph for the expression (MFI) of IFN-γ expression in IL-12/15 or poly(I:C) - stimulated LrNK cells from 8-week-old control and early-Abx mice (n = 6 per group). h Cytotoxicity of LrNK cells against CFSE-labeled YAC-1 cells. 7-AAD+ CFSE+ cells represented the killed cells (control n = 6, early-Abx n = 8). i Representative FACS plots and bar graph for the expression (MFI) of Tim-3, NKG2A and PD-1 in LrNK cells from control and early-Abx mice (control n = 6, early-Abx n = 7). Each symbol represents data from an individual mouse, and error bars represent SEM per group in one experiment. Data were analyzed using two-tailed Student’s t-test. *P < 0.05; **P < 0.01; ***P < 0.001; ****P < 0.0001; ns, no significance. All experiments were repeated two or three independent experiments. Source data are provided as a Source Data file.

